


Dax ahead of ZEW sentiment data
European indices are heading higher across the board after the Dow & S&P 500 shot to a record highs on Monday.
German ZEW sentiment data is expected to show an increase in moral in March to 74 from 71.2.
Concerns regarding the AstaZeneca covid vaccine could cap gains.
Attention turns towards the FOMC tomorrow.
Earnings from Volkswagen
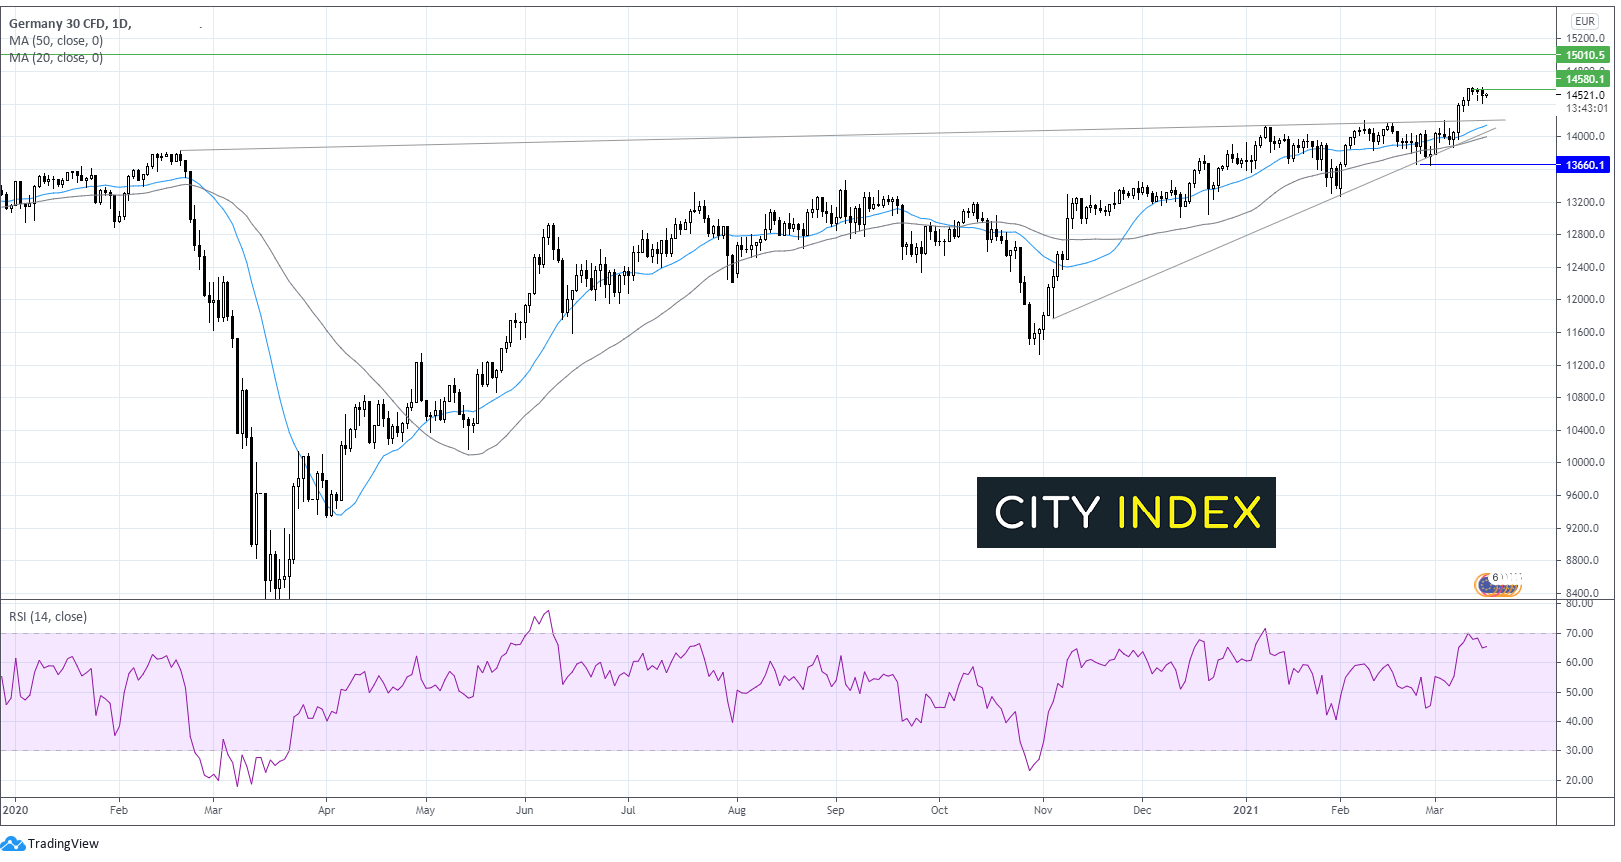
Where next for the DAX?
The Dax had been trading within an ascending triangle, trading in a tight range at the upper band. The Dax broke above the upper band and key resistance around 14200 last week and hit a fresh all tine high.
This resistance area had capped the Dax across 2021 so far. This bullish break out could mean further gains are to be had. Importantly the Dax has managed to hold above 14200 which has now become a key support level.
The RSI is also supportive of further gains until overbought territory is reached.
Given that resistance up at these levels is sparce. Immediate resistance can be seen at 14530, the new all time high. Beyond here 15,000 could draw the bulls.
Support can be seen at 14200 trendline followed by 14000 round number and 13660 swing low February 24.
Learn more about trading indices
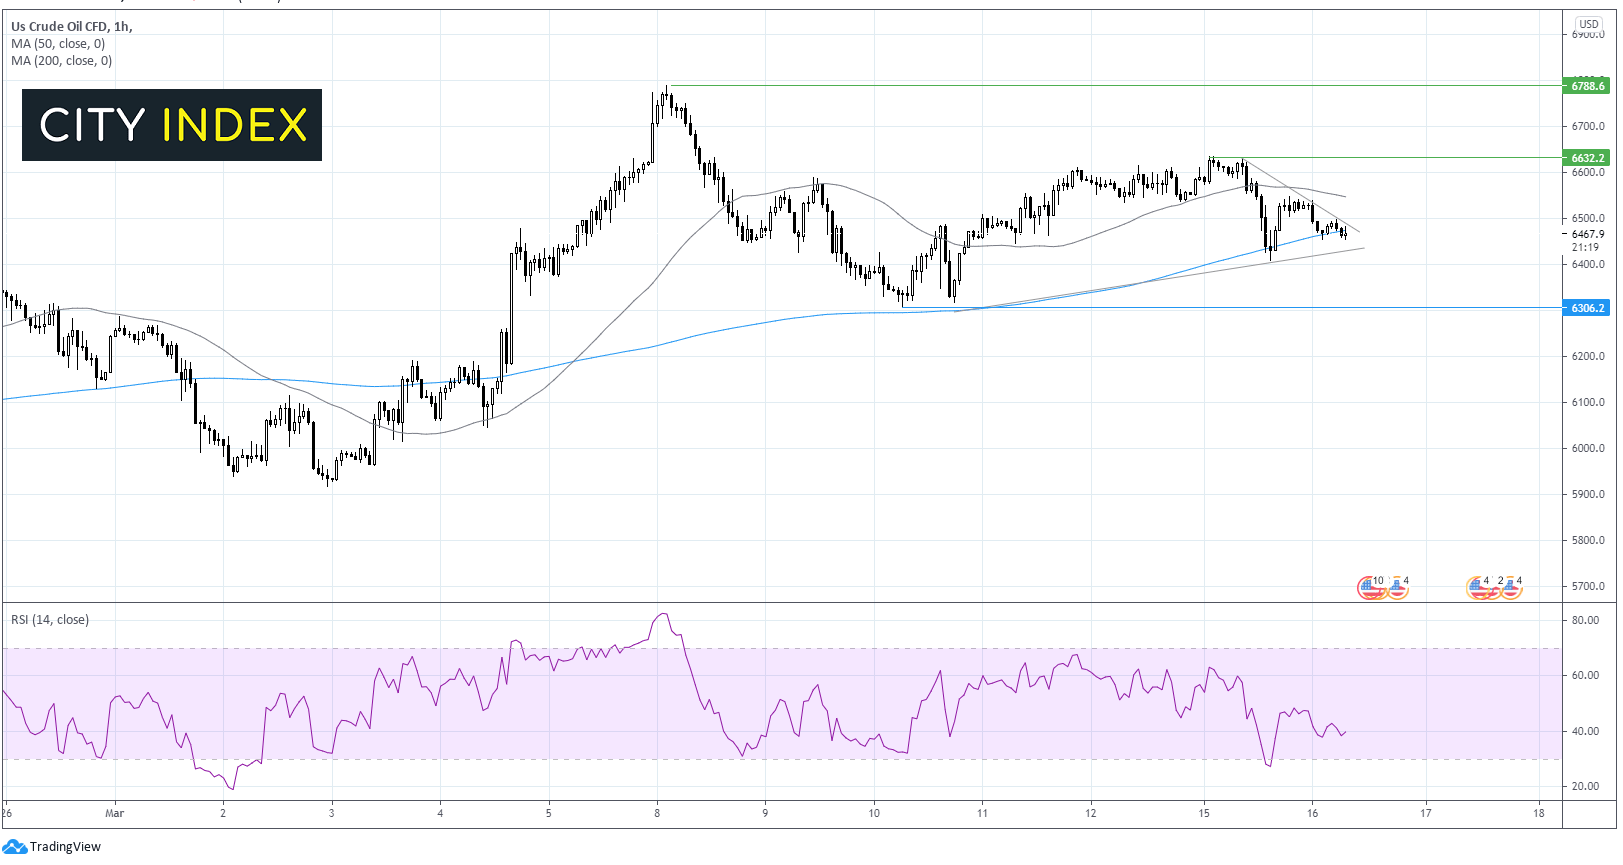
WTI picks off lows ahead of API data
With covid cases rising again in the likes of Germany, France and Italy and the AstraZeneca vaccine suspended concerns over further lockdowns and demand are weighing on crude.
The slow vaccination programme in the region is adding to the concerns.
Concerns that the Texas storm could continue to boost inventories are also weighing. Inventories increased by 12.8 million in the week ending 5th March.
Where next for WTI US crude oil?
WTI is extending losses for a third straight session. After picking up off 64.00 low yesterday, the price is currently testing the 200 hour moving average at 64.75. Whilst the RSI is mildly bearish it is pointing northwards so further trimming of losses could be in store.
Should this level hold then oil could look to target $65.00 the upper band of the descending trendline dating back to yesterday. A break above this level could see the 50 sma tested at 65.50 ahead of 66.30 Monday’s high. A meaningful move above this level will negate the bearish trend.
Failure for the 200 HMA to hold could see the bears look to break through the lower band of the ascending trend line before targeting 63.00 low March 10.