


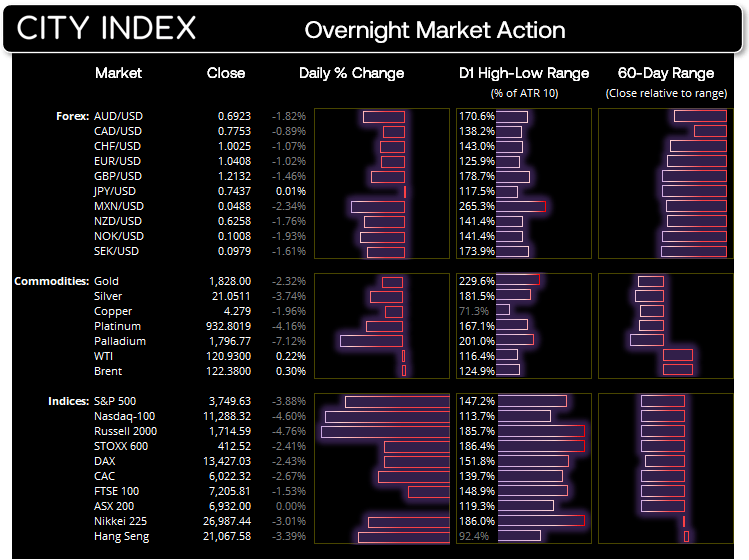


There are various degrees of risk-off, and markets have just entered one of the worst kinds. An example of a less severe form of risk off would be when equities tumble due to a slew of weak earnings, and currencies or bonds take little to no notice. A sure sign of a classic ‘risk-off’ environment would be when equities, commodities and bond yields fall yet bond prices (which move inversely to yields) and gold rise as they’re considered to be ‘safe-haven’ assets. But that’s not what we’re currently seeing.
There’s multiple signs that investors are de-risking
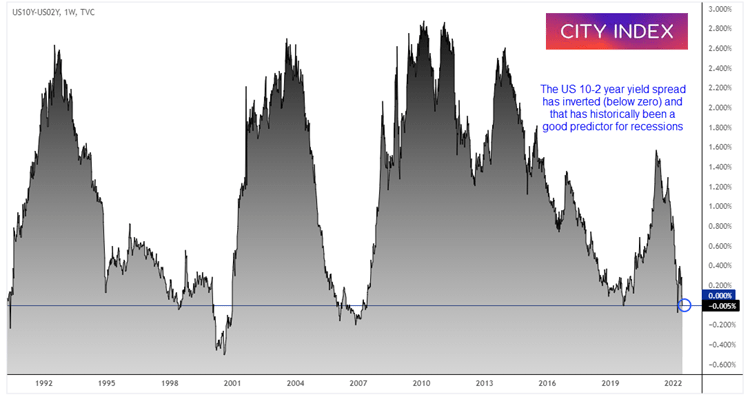
The S&P 500 has entered a technical bear market, the US 2s 10s yield curve inverted (a harbinger of doom if there ever was one) and gold (typically a safe-haven) also being hurled overboard. This is de-risking at its finest. Investors are rushing for the same small exit in hope of offloading their falling assets for cash.
Why are investors de-risking?
The straw which broke the camel’s back was the very hot inflation report form the US on Friday. There had been hopes that inflation had peaked, yet clearly it has not. Eurozone employment also reached a record high last week and central banks are now being forced to hike rates at the risk of tipping the economy into a recession. And to really spice things up, the Fed, BOE and maybe even the SNB are expected to hike interest rates this week. And there are now talks of the Fed even having to hike by 75-bps this week to save credibility.
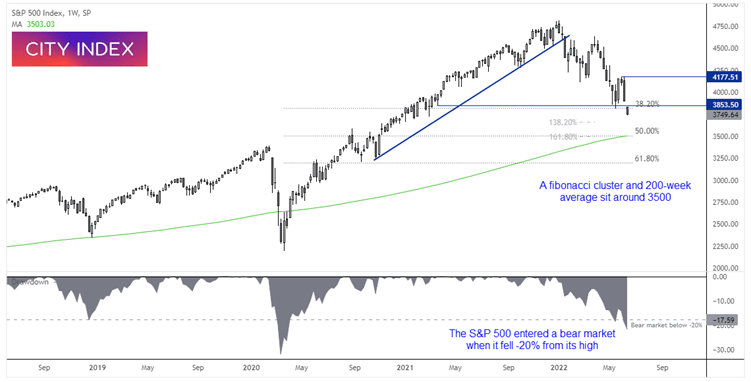
The S&P 500 entered a technical bear market
US equities were sharply lower yesterday and entered a technical bear market having fallen -20% from its high. A series of lower lows and highs shows us that the weekly chart is in a confirmed downtrend, although it should be remembered that ‘bear market rallies’ can post strong returns before breaking to new lows. Our bias remains bearish below 4,000 and for a drop down to 3,500, where the 200-week average, and 50% retracement and 161.8% Fibonacci projection reside.
Read our S&P 500 trading guide
How to trade with City Index
You can easily trade with City Index by using these four easy steps:
-
Open an account, or log in if you’re already a customer
• Open an account in the UK
• Open an account in Australia
• Open an account in Singapore
- Search for the company you want to trade in our award-winning platform
- Choose your position and size, and your stop and limit levels
- Place the trade
Latest market news
Yesterday 01:23 PM
Yesterday 06:01 AM
April 18, 2024 11:27 PM
Latest Technical Analysis articles
April 15, 2024 07:13 PM
April 14, 2024 11:37 PM
April 13, 2024 08:00 PM
April 12, 2024 04:51 AM