


For those wanting a reminder of the doom and gloom, here’s just some of the recent data points which point towards a potential recession in the US. And as markets are forward looking they’re not waiting to wait for any recession to arrive.
- US consumer sentiment hit a record low, according to the University of Michigan.
- The Fed are aggressively hiking to tame increasingly hot inflation (and Fed Funds remain historically low relative to inflation).
- The housing sector continues to buckle under the weight of higher interest rates.
- The Sales Managers Index (SMI) has dipped below 50 to predict a recession.
- New orders for the Philly Fed index contracted for the first time in 2-year in May.
Can the ISM manufacturing and services PMI’s contract in the months ahead?
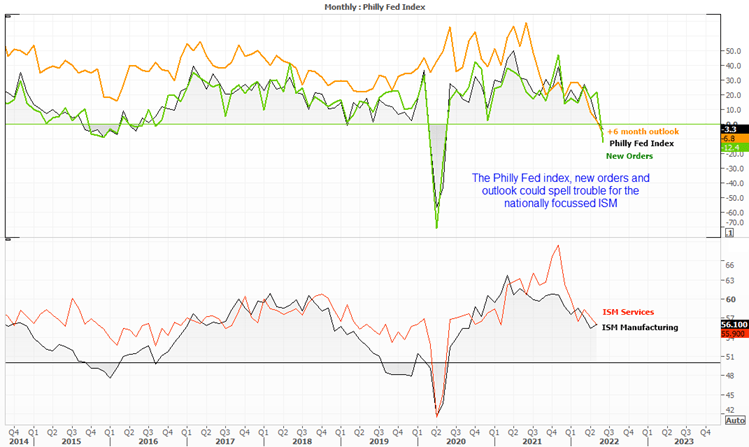
As the ISM manufacturing and services PMI’s are at the national level, it makes sense that we may see weakness at the regional level ahead of the ISM’s. It is therefore worth noting that the Philadelphia Fed Index contracted in May for the first time since the pandemic, along with the outlook (+6 month) and new orders. We therefore suspect the ISM’s may continue to weaken in the months ahead, and potentially contract with a print below 50.
Battle of the yield curves
Recession bells were ringing again recently as a widely followed yield curve (US 10-year – 2-year) ‘inverted’ by dipping below zero. The inverted yield curve is considered by many to be a predictor of a recession by around 12-18 months ahead.
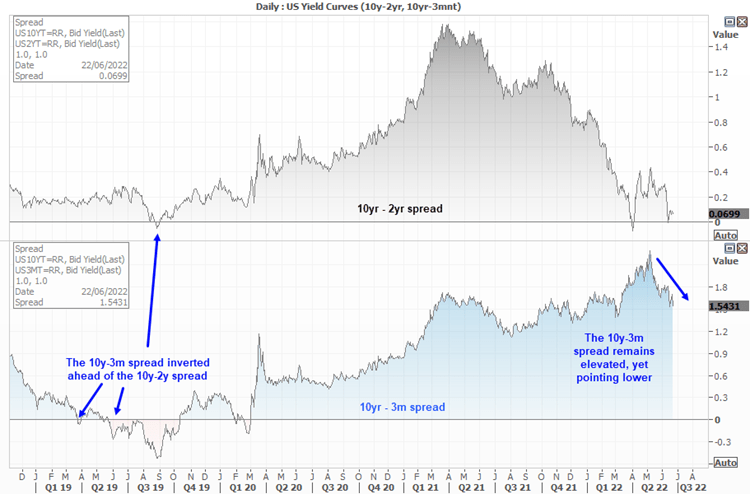
However, some consider the 10-yr minus 3-month a better predictor of recession, and that has yet to invert since Q1 2019. In fact, the Federal Reserve use this spread to gauge the probability of a recession. And that it remains relatively high at +1.54%, it could help explain why the Fed continue to signal to markets they can raise rates without triggering a hard landing. However, take note that the spread topped in early May and is moving sharply lower, which suggests that bond traders see a recession as more likely than it was a few weeks ago.
What are markets telling us about a potential recession?
The S&P 500 and Nasdaq entered technical bear markets by falling over 20% from their recent highs. Although the Dow Jones is yet to breach the threshold as is ‘only’ down around -18% from its highs. Yet as US indices have been trending lower throughout the year, it comes into question as to whether a recession has been priced in.
My best guess is that a recession has not yet been priced in. Inflation is yet to soften and we’re yet to see the true impact of the Fed’s hikes. A Reuters poll suggests another 75-bps hike is on the horizon in July, followed by a 50-bp hike in September. And without any positive headlines or data points hitting our screens, at best we’ve just entered a much-needed retracement against an oversold market.
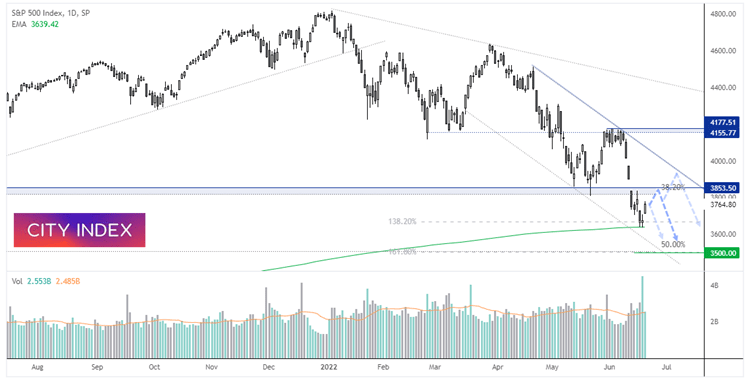
Seeking 3500 once the S&P 500 retracement is complete
The S&P 500 trades within a bearish channel on the daily chart. It has found support at its 200-week eMA and Friday’s low coincided with a high-volume Doji to suggest a swing low. Risk assets rallied in line with our expectations yesterday, and we may even see it extend gains to the 3800/83 resistance zone – which is likely a pivotal area of resistance.
For now, our bias is bearish below 3854 and will seek bearish reversal up to that level, with a view for it to fall to the 3500 area (not a long-term 38.2% Fibonacci retracement and 161.8% expansion). A break above the resistance zone could see the retracement extend to the upper channel, where we would again revert to a bearish bias - in line with its dominant bearish trend and dire macro backdrop.
Read our S&P 500 trading guide
How to trade with City Index
You can easily trade with City Index by using these four easy steps:
-
Open an account, or log in if you’re already a customer
• Open an account in the UK
• Open an account in Australia
• Open an account in Singapore
- Search for the company you want to trade in our award-winning platform
- Choose your position and size, and your stop and limit levels
- Place the trade
Latest market news
Latest Technical Analysis articles
April 15, 2024 07:13 PM
April 14, 2024 11:37 PM
April 13, 2024 08:00 PM
April 12, 2024 04:51 AM