


April 26, 2022 6:39 PM
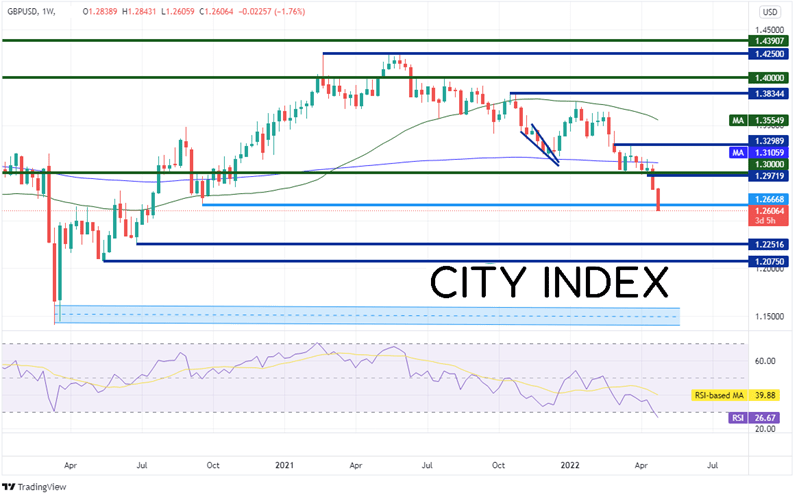
GBP/USD has been moving lower since June 2021 when the pair reached a high of near 1.4250! However, the selloff continued after the last BOE meeting when officials warned that inflation, particularly due to the Russia/Ukraine war, could squeeze household incomes. Therefore, future interest rate increases would depend on the medium-term lookout on inflation. Inflation rose from 6.2% in February to 7% in March. However, it wasn’t until late last week that that GBP/USD began to take a nosedive as both consumer confidence and retail sales were much weaker than expected. The combination of a squeeze in household income, weaker economic data, and a strong US Dollar, was enough to push GBP/USD below the psychological round number support of 1.3000 and the pair hasn’t looked back since. GBP/USD is currently trading at its lowest level since July 2020. However, unlike the DXY and EUR/USD which are approaching March 2020 levels, GBP/USD is not. The pair reached a low of 1.1445 at the height of the pandemic in March 2020. On the weekly timeframe, horizontal support isn’t until 1.2252 and then 1.2075. Below there and price can fall to the March 2020 lows. Notice that the RSI on the weekly timeframe is oversold, indicating the possibility for a bounce.
Source: Tradingview, Stone X
Trade GBP/USD now: Login or Open a new account!
• Open an account in the UK
• Open an account in Australia
• Open an account in Singapore
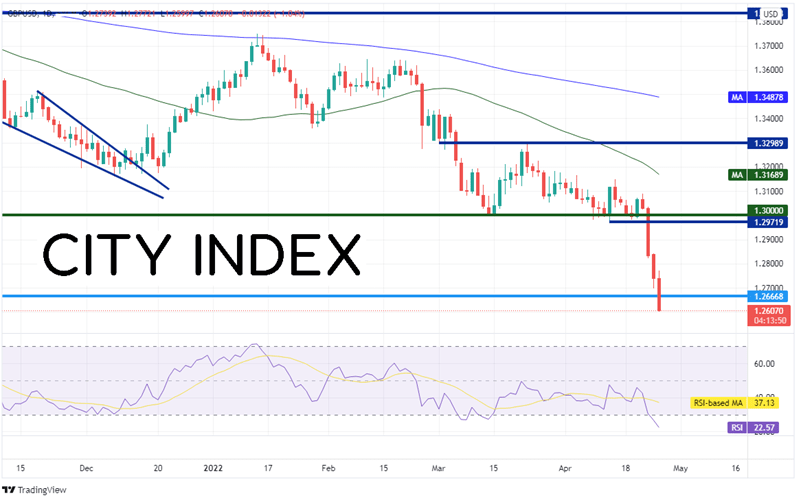
On a daily timeframe, over the last 4 sessions, traders have sold GBP/USD from 1.3090 down to today’s low, just below 1.2600. Notice that the RSI on the daily timeframe is also in oversold territory. If price does bounce, first resistance is at recent horizontal support (now resistance) at 1.2667. Above there, price can trade up to the lows of April 13th at 1.2971.
Source: Tradingview, Stone X
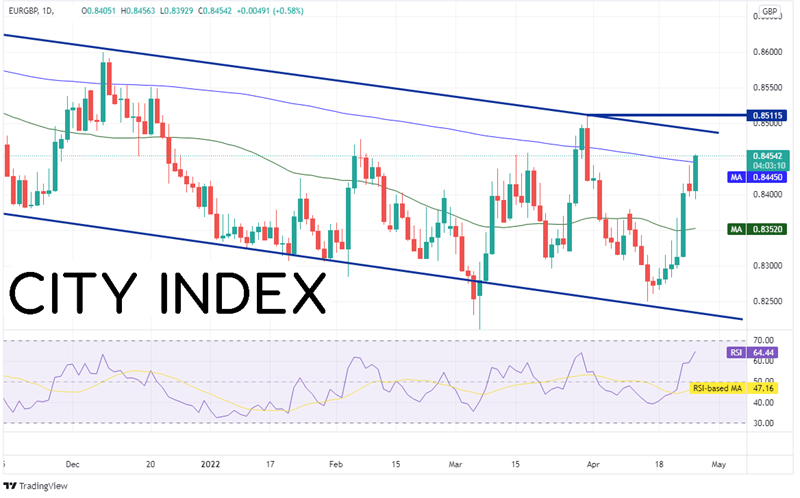
GBP/USD isn’t the only Pound pair that has been on the move lately. EUR/GBP has been moving in a downward sloping channel since April 2021. However, the pair has been pushing higher (GBP lower) since April 18th, including a bullish engulfing candle today. EUR/GBP also pushed above the 200 Day Moving Average at 0.8445. This now acts as the first level of support. Today’s low is the next level of support at 0.8393 and then the 50 Day Moving Average at 0.8352. If price continues to move higher, first resistance is at the top, downward sloping trendline of the channel near 0.8490, then the March 31st highs at 0.8512.
Source: Tradingview, Stone X
Trade EUR/GBP now: Login or Open a new account!
• Open an account in the UK
• Open an account in Australia
• Open an account in Singapore
Fears that inflation would hit household income helped GBP/USD continue its path lower since mid-March. However, it wasn’t until last weeks poor economic data that caused the wheels to fall off the Pound. The BOE meets next week. Watch to see if traders take profits ahead of the meeting, which may give GBP a boost.
Learn more about forex trading opportunities.
Latest market news
Today 11:14 AM
Today 08:28 AM
Yesterday 03:30 PM
Latest Forex articles
Yesterday 11:00 AM
April 23, 2024 11:09 PM
April 23, 2024 04:00 PM