


What a difference a week can make. A short while ago we were staring down the barrel of a financial meltdown but, now central powers have stepped in, sentiment has taken a turn for the better. The question facing traders now is whether inflation US inflation can soften whilst economic data remains robust enough (but not too hot) to justify a less hawkish Fed. If so, it could potentially support a breakout for Wall Street indices and extend a rally for the ASX 200.
Over the past two weeks we have seen the BOE and SNB raise interest rates despite the financial turmoil across the banking sector in the US and Europe. First Citizen were also able to purchase failed Silicon Valley Bank thanks to US authorities expanding balance sheets for regional banks, whilst key Fed members endorsed the strength of US banks and lay the blame to SVB’s demise on mismanagement.
Whether this turns out to be short-lived remains to be seen, but sentiment has certainly perked up in recent days. Unfortunately (depending on which way you look at it) it means our short Nasdaq bias did not come to fruition. But that is trading. And knowing when something hasn’t worked is part of the game. So where from here?
A soft inflation report could extend a risk-on rally
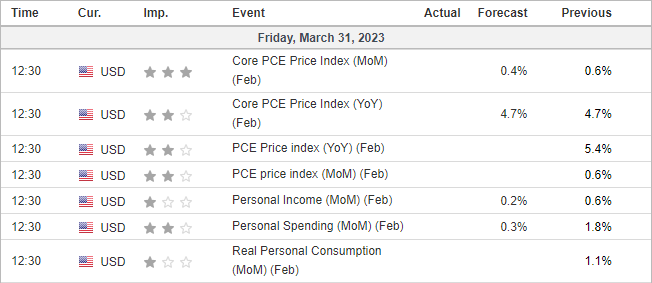
(Calendar times in GMT)
The Fed’s preferred inflation measure is released on Friday; the personal consumption expenditures index (PCE). With money markets desperately trying to price in cuts this year (despite the Fed telling them to forget it), a soft inflation report would likely boost sentiment as it calls for a lower terminal rate and increases the odds of said cuts.
The icing on the cake would be if softer inflation is accompanied without any more banks imploding, as that would likely send risk assets higher and the US dollar lower. Of course, it is a double-edged sword which cuts both ways, as hot inflation and weak sentiment could easily send global equities lower as sentiment is dragged back down to the gutter.
- The ideal scenario for indices is for an all-round softer inflation report coupled with risk-on sentiment.
- The most bearish scenario for indices heading into the weekend would be an al-round stronger inflation report amidst a risk-off session.
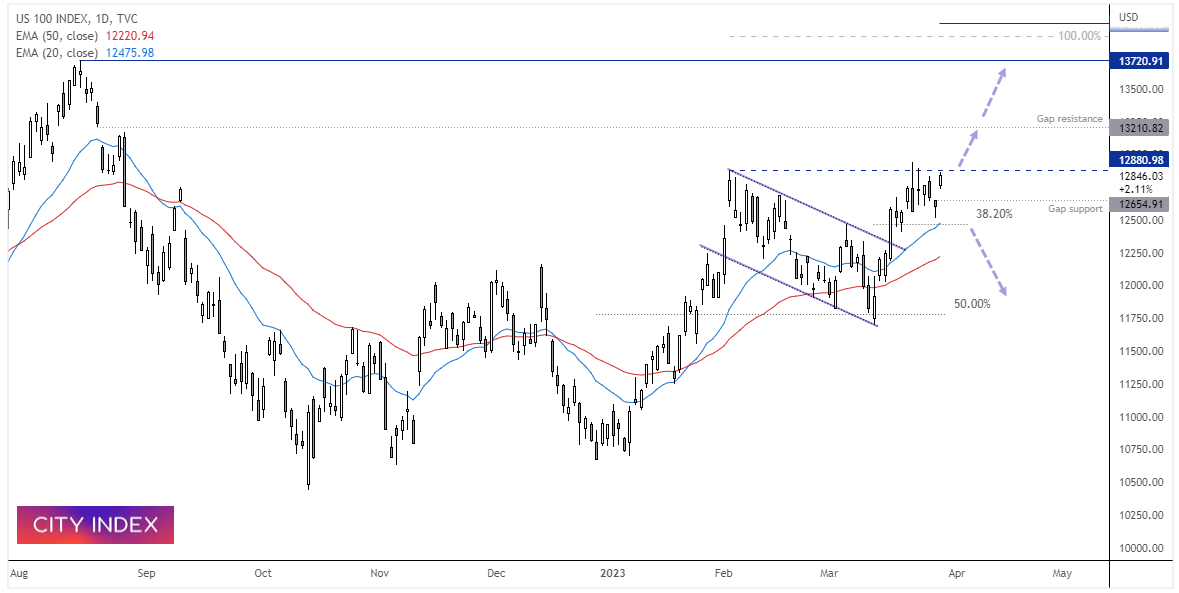
Nasdaq 100 daily chart:
Despite a compelling bearish outside/engulfing day last Wednesday and genuine fears of a financial meltdown, the short Nasdaq bias clearly did not come to fruition. Instead, we saw a small bullish hammer failed to hold beneath the engulfing low on Tuesday, and prices gapped higher yesterday.
Given this is still part of a breakout from a corrective channel and the Nasdaq continues to print higher lows, we have to consider its potential to break to new cycle highs.
- A 100% projection of the December low to February high (from the March low) lands just below 14,000, which makes it a potential longer-term target for bulls.
- Over the longer-term, the bias remains bullish above the 20-day MA / 38.2% Fibonacci level and for a move towards 14,000 / 100% projection (although take note of gap resistance at 13,210 and the August high at 12,720 which makes viable resistance levels)
- Over the short-term, bulls could remain bullish above yesterday’s high / gap support and seek a move to the 13,200 gap target
- A move below the 38.2% Fibonacci ratio assumes the market has topped
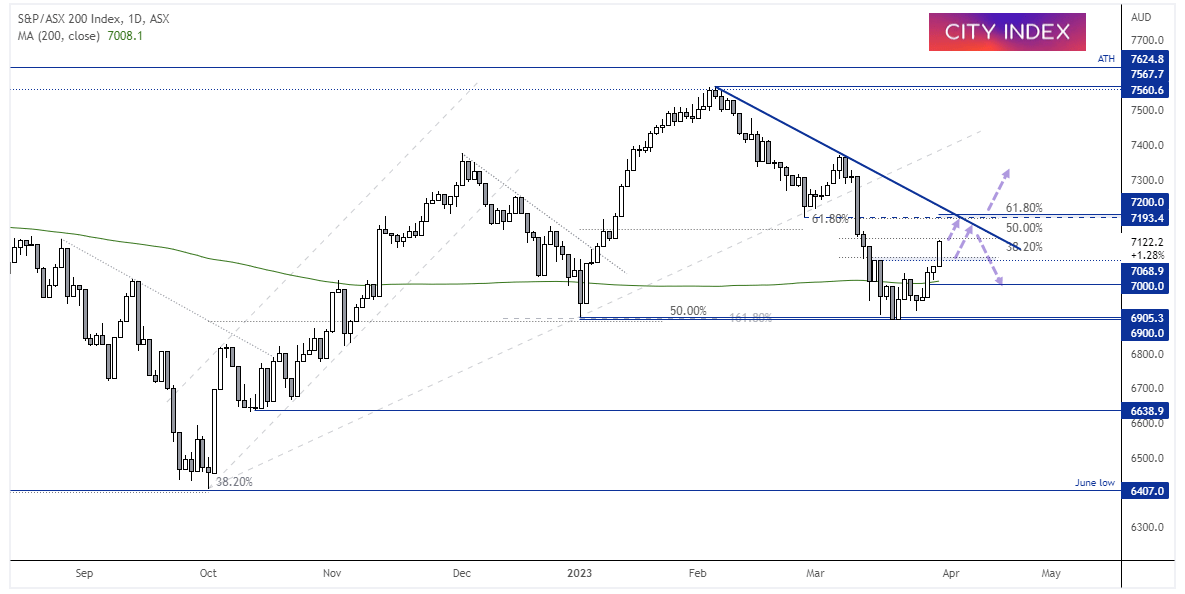
ASX 200 daily chart:
The ASX made an mild (and ultimately failed) attempt to close beneath the January low, and has since broken convincingly above the 200-day MA and 7,000 handle, and now sits at a 12-day high. Trading volumes were also below average when prices ranged between the 6900 – 7000, which showed a lack of commitment form the bear camp before its reversal.
The index appears set to head for the 7200 area, which coincides with a 61.8% Fibonacci ratio and the February low. From here, bulls could consider longs above the 7068 / 7070 area on lower timeframes or wait for a break of Thursday’s high and aim for trend resistance/ 7200 area. We’d expect this area to hold as resistance initially, with its next directional move likely to be dictated by global sentiment.
-- Written by Matt Simpson
Follow Matt on Twitter @cLeverEdge
How to trade with City Index
You can trade with City Index by following these four easy steps:
-
Open an account, or log in if you’re already a customer
• Open an account in the UK
• Open an account in Australia
• Open an account in Singapore
- Search for the market you want to trade in our award-winning platform
- Choose your position and size, and your stop and limit levels
- Place the trade