


Big tech report whilst hovering around all time highs
Heading towards US tech stocks earnings seasons the Nasdaq is trading around its record high record high.
The reflation trade is in retreat. Growth expectations have soured, reflected in falling US treasury yields which tumbled to a 4-month low last week, reigniting the rotation back into high growth tech stocks and boosting the Nasdaq to a fresh all-time high earlier this week.
With US big tech trading at all time highs ahead if earnings expectations are high and concerns are circling that the good news is already prices in.
Earnings season
Expectations are high. Bloomberg forecast 65% growth in EPS in SP500 companies. Tech are are expected to lag other sectors with a 31% increase in earnings.
However, it’s worth keeping in mind that tech stocks will mainly be up against tougher comparisons from last year than in the previous quarter as these are the stocks which shone across the pandemic amid the WFH dynamic and accelerated digitalization.
Big tech to watch in earnings:
Netflix – July 20
Netflix is up against some extremely tough year ago comparisons. Streaming subscriptions surged in Q2 2020 in lockdown. Netflix added 10 million new subscribers in the Q2 last year pulling in almost 26 million subscribers in the first half of last year. Management at Netflix believe that a lot of demand for streaming was pulled forward to 2020, explaining why Netflix added just 4 million in Q1 2021 and why Netflix is guiding for just 1 million new subscribers in Q2 2021. Guidance for Q3 could start to normalise. Any news surrounding the new gaming direction will be in focus.
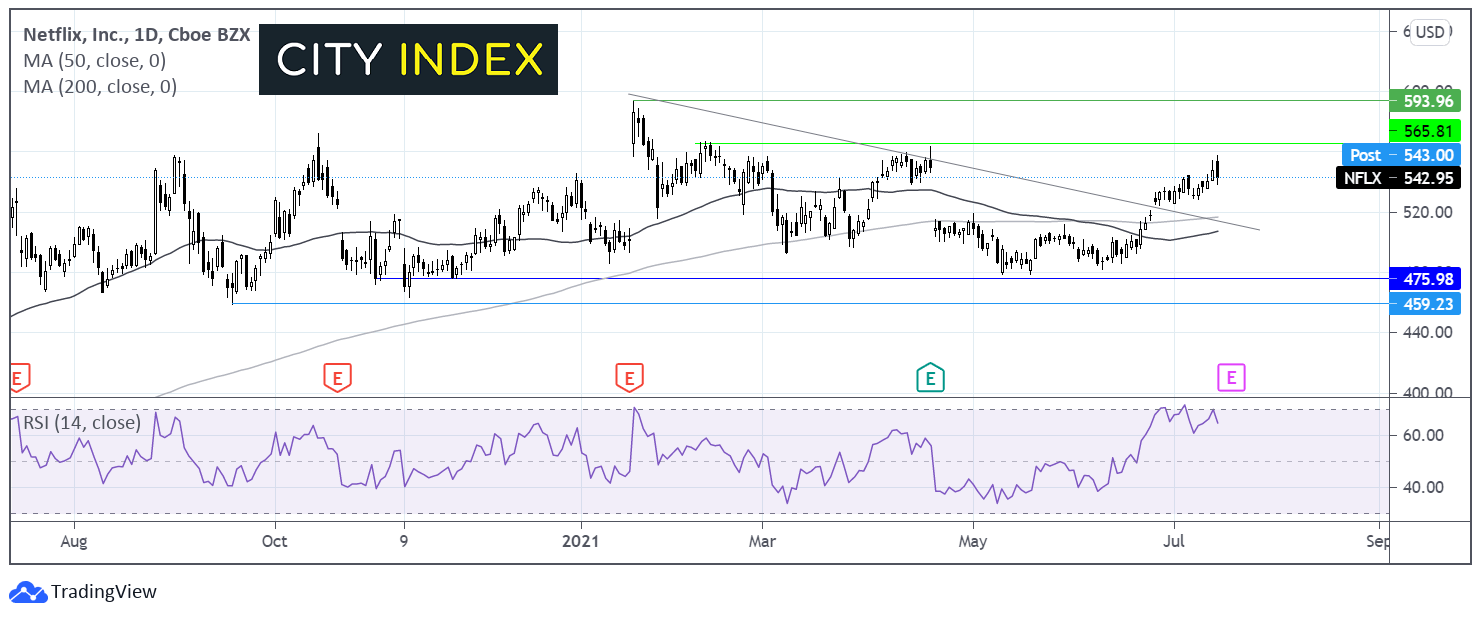
Where next for Netflix share price?
After hitting an all-time high of 593 at the start of the year, Netflix formed a series of lower highs, before finding a floor at 475. The price has rebounded of this level and has continue to trend higher, pushing back above the descending trendline and the 50 & 200 dma. The RSI suggests there could more upside to come whilst it remains out of overbought territory. Buyers could look for a move over 565 in order to attack 592 and look towards a new all-time high. Sellers could look for a move below 515 to negate the near-term uptrend.
Apple – July 27
Fiscal Q2 was a stellar quarter for Apple. Revenue roared 54% in Apple’s fiscal second quarter reported in April, and EPS came in at $1.40 versus $0.99 forecast so the bar is set high. That of course was an easy comparison for the year earlier.
iPhone 12 sales as always are going to be in focus with expectations for some resilient numbers. The higher end product line up is expected to outperform, which should be good news for margins. Furthermore, the fast growing services businesses has been boosting gross profit margins as the margins are about twice that of its product business.
Also let’s not discount the iPad, iPad sales have surged in recent quarters amid the WFH trends. After the new M1 equipped iPad pro in released in April could the iPad outshine the iPhone this time? Q3 revenue is expected to rise 22% YoY, up against a tougher comparison, although this would still be tied for Apples second largest growth rate in many years. Wall Street expects EPS $0.99 on revenue of $72,780 million
Where next for Apple share price?
Apple traded between $115 and $140 for most of the first half of 2021. In early June Apple share price rebounded off the 200 dma and has powered higher breaking out beyond the previous al time high of $145 to $150. The RSI has moved into over bought territory so some consolidation or a move lower could be on the cards. As long as the price holds above $145 fresh all time highs could be reached.

Microsoft - July 27th
Microsoft has surged across the year. The share price has regularly hit fresh all-time highs one month after another. Q3 saw a 38% rise in profits to $14.8 billion compared to the same period a year earlier. Gains were broad based across the business with the working from home dynamic, Xbox X gaming console boosting sales. Fiscal Q4 will be under the microscope due to its Window 11 upgrade. is set to have expected torpor revenue growth of 16% in its June quarter on EPS of $7.77
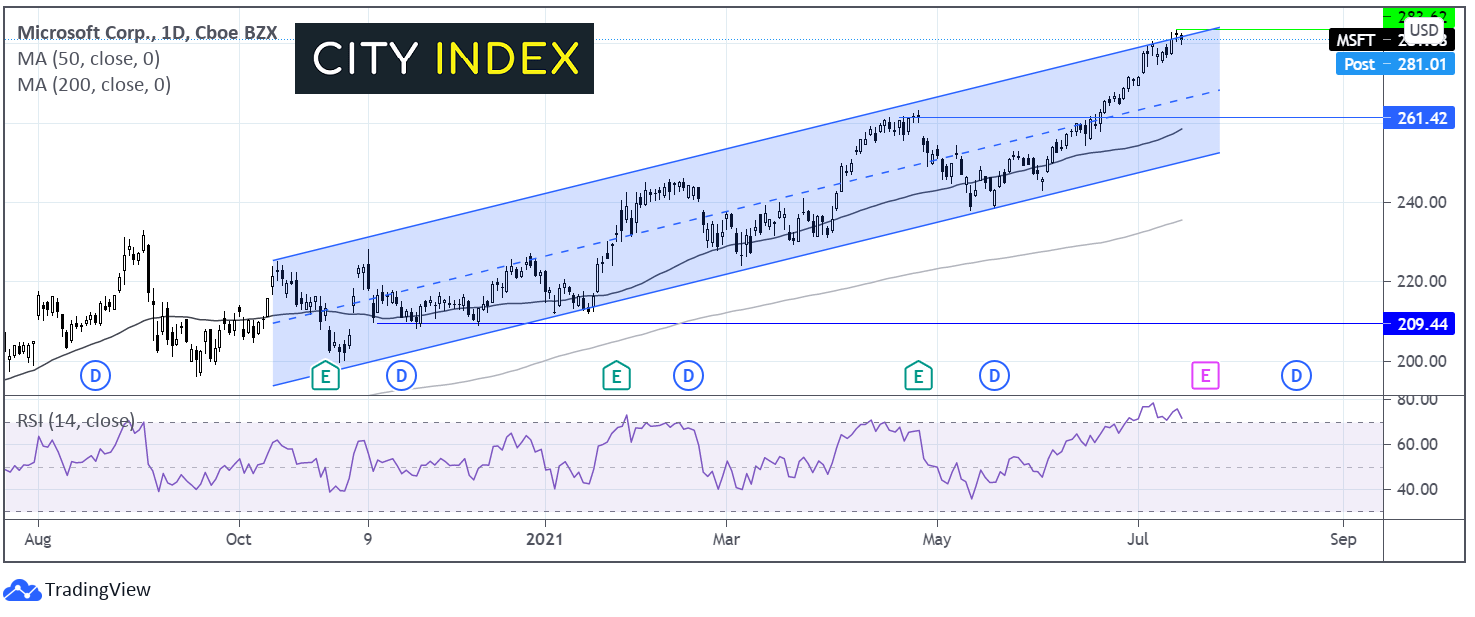
Where next for Microsoft share price?
Microsoft has rallied 14.5 % across the quarter against the S&P500 8% gains. The share prices trades within ascending channel even breaking out briefly above the upper band of the channel, in a strong bullish trend. Watch for overbought conditions on the RSI. Bulls are firmly in control it would take a move below 260 to negate the near term up trend.
Alphabet – July 27
Alphabet has had a stellar year rallying 44% so far. This because Alphabet has managed to benefit in part from the reopening play as well. With businesses reopening they go online to promote themselves boosting advertising revenue. Alphabet is expected to continue generating strong growth on the back of its dominant advertising, streaming and cloud computing businesses – the company operates numerous businesses and controls many products and services which are likely to produce more substantial revenue going forward. For example, Q1 2021 YouTube advertising sales saw a 49% YoY increase whilst the Google cloud business saw revenue rise 46% YoY. The fact that Google is facing anti-competitive allegations for the fourth time this year hasn’t seriously hindered the share price rally so far, but developments will be watched carefully. Expectations are for EPS $16.14 on revenue $56.03.
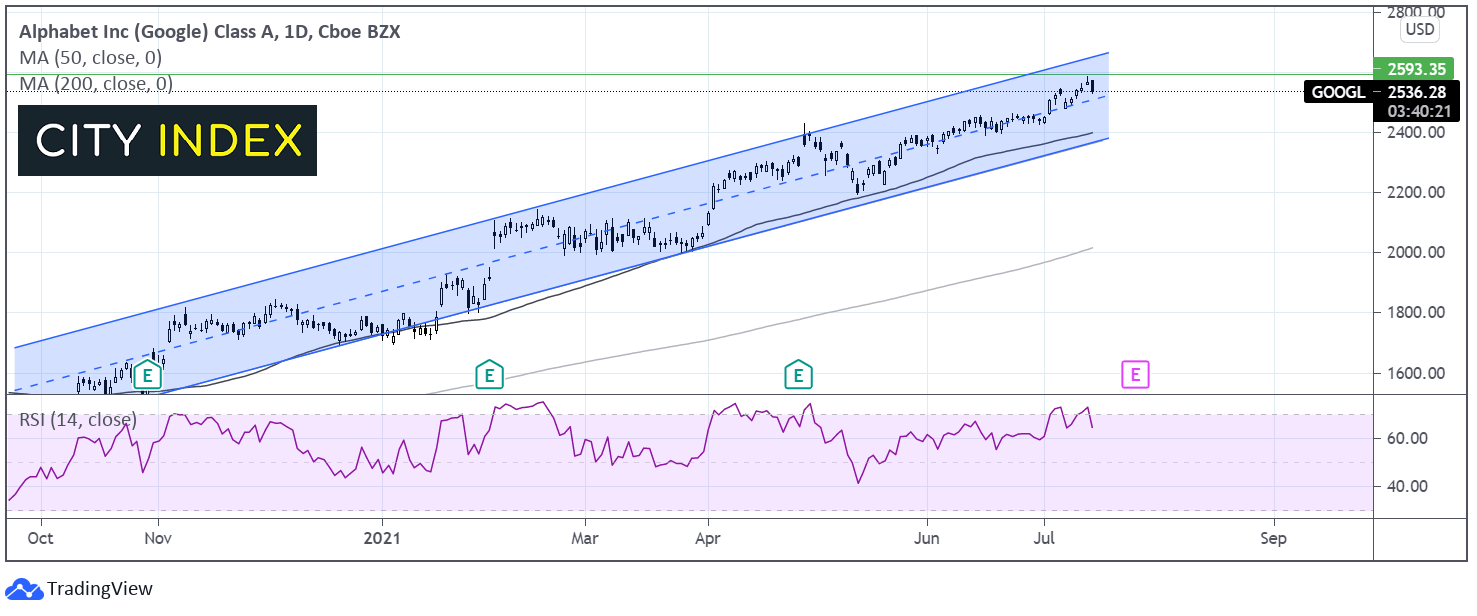
Where next for Alphabet share price?
The share price has rallied 18% so far in Q2 going from new record high to new record high. The recent sell off seen this week has barely touched the sides of the rally but has brought the RSI out of overbought territory. The 50 sma has offered support at several points across the rally. A move below this support at 2400 could negate the near-term uptrend. On the upside, beyond 2585 the all-time high, resistance could be met around 2640 the upper band of the ascending channel.
Facebook -July 28
Facebook crushed analysts estimates in Q1 with earnings revenue jumping 48% to $26.2 billion, well ahead of the $23.7 billion forecast. The advertising business saw a 30% yoy increase in price per ad and 12% more ad impressions. Strong momentum is expected to continue into Q2 with Facebook guiding for the revenue growth rate to remain steady or modestly accelerate. This bodes well given that FB guidance is usually conservative. Also let’s not forget that Facebook is up against a rather easy year on year comparison where revenue grew just 11% as covid lockdowns meant companies reduced their ad spend.
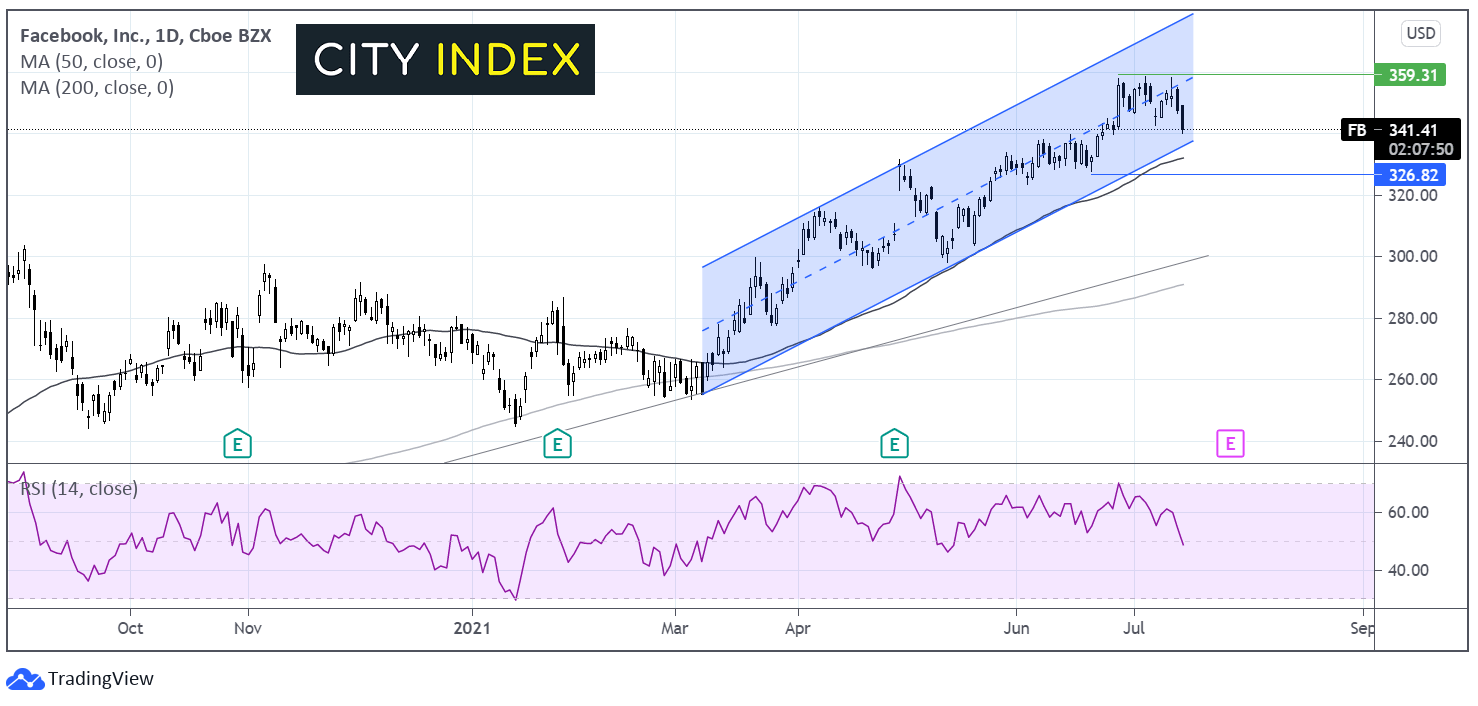
Where next for Facebook share price?
Facebook trades within its ascending channel dating back to early March. It trades above its 50 & 100 dma, showing an established bullish trend. Today’s fall lower has seen the share price slip below the mid point of the ascending channel, however, it has traded for extending periods below the mid-point. The bias remains bullish. It would take a move below $325 the lower band of the ascending channel and the 50 sma to negate the near term uptrend and for sellers to gain traction. On the up side a move above $360 is needed for FB to reach fresh all time high.
Amazon – July 28
Thinking back to Q2 in 2020, Amazon delivered outstanding revenue growth of 40% its highest since 2018 whilst EPS beat consensus by the biggest ever margin.
Digital consumption, cloud adoption and acceleration worked in Amazon’s favour whilst most businesses were closing down. Expectations are for revenue growth of 30% on ESP of $12.22 a 20% increase. E-commerce was huge across the pandemic. However, e-commerce was gaining share from physical retailers before the pandemic started, so the pandemic accelerated a trend which as already in place. This perhaps means its unlikely to reverse.
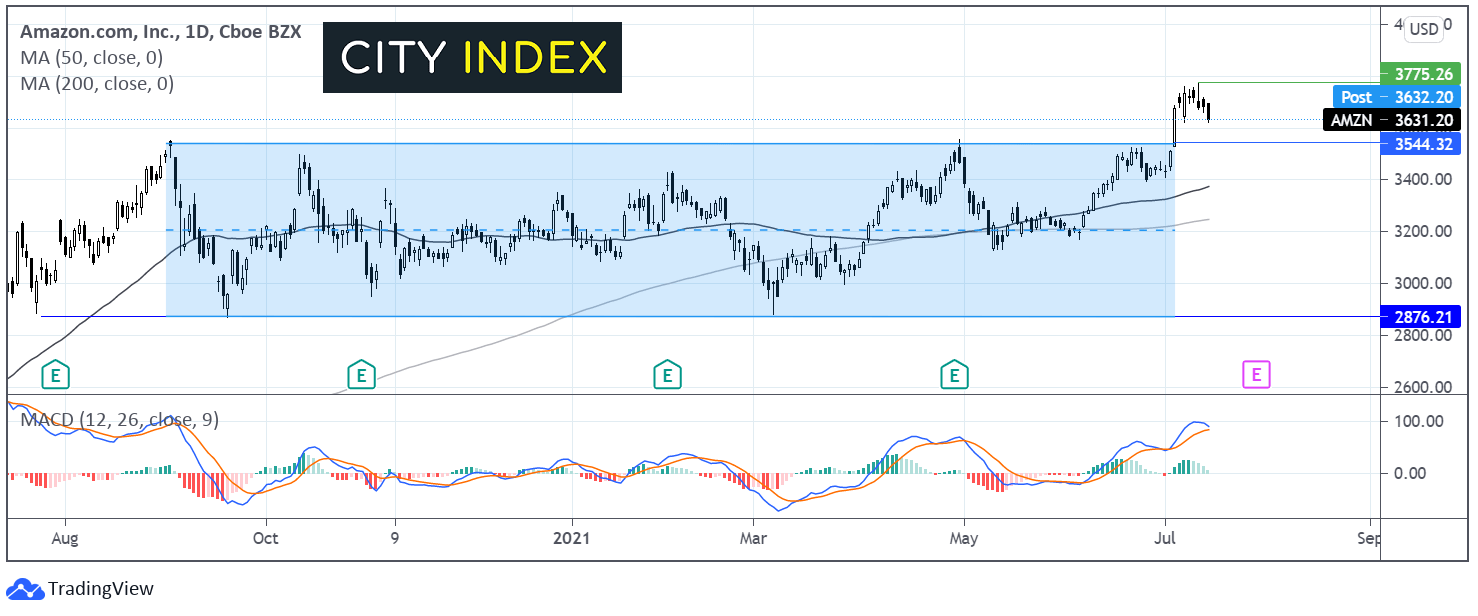
Where next for Amazon share price?
Amazon share price had been trading range bound since September capped on the lower band by 2875 and by 3500 on the up side. The recent break through the 3500 level sent the share price to fresh all-time highs of 3775. A receding bearish bias on the MACD backs a move lower, particularly if a bearish crossover forms. It would take a fall below below 3500 to negate the current uptrend.
How to trade with City Index
Follow these easy steps to start trading with City Index today:
- Open a City Index account, or log-in if you’re already a customer.
- Search for the market you want to trade in our award-winning platform.
- Choose your position and size, and your stop and limit levels
- Place the trade
Latest market news
Yesterday 01:23 PM
Yesterday 06:01 AM
April 18, 2024 11:27 PM
April 18, 2024 04:46 PM
Latest Tech Stocks articles
October 19, 2023 09:47 AM
October 11, 2023 02:41 PM
October 3, 2023 12:24 PM
October 2, 2023 01:47 PM