


February 13, 2023 8:29 PM
Earlier today, Switzerland released its January CPI report. The headline print was 3.3% YoY vs an expectation of 2.9% YoY and a prior reading of 2.8% YoY. That is a jump of 0.5%! This was the highest reading since September 2022. In addition, it was the first increase since August 2022. Inflation was either unchanged or had fallen since then. This print will be a surprise to the SNB as it had left its annual projection for 2023 inflation at 2.4%. When the central bank last met, it increased interest rates by 50bps to bring borrowing costs to 1.00%. Note that it was only September when the SNB brought interest rates out of negative territory by raising rates from -0.25% to 0.50%. The SNB doesn’t meet again until March 23rd, so it will get one more look at inflation data before its next meeting. If it’s another large jump, expect the central bank to be aggressive. Right now, traders are wondering if the next hike will be another 50bps, or more! The SNB also intervenes as necessary in the fx markets “to provide appropriate monetary conditions”.
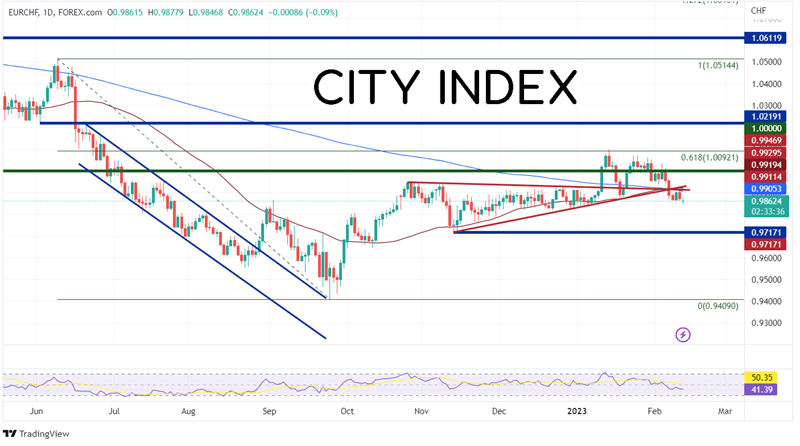
EUR/CHF began moving lower from its most recent high on June 9th, 2022, when price was near 1.0612. Over the next few months, EUR/CHF traded lower in a channel formation before bouncing above it on August 29th, 2022 near 0.9630. However, the pair ran into was held below resistance at the 50 Day Moving Average as the pair continued lower to 0.9409 on September 26th, 2022. From there, EUR/CHF retraced to the 61.8% Fibonacci retracement level from the June 9th, 2022 highs to the September 26th 2022 lows near 1.0092 on January 13th. Price has been moving lower since then and on February 7th, price made a decisive move, trading below 2 trendlines and the 50-Day and 200-Day Moving Averages. Notice that EUR/CHF traded in a symmetrical triangle from November 2022 until January, before finally posted a false breakout to the topside.
Source: Tradingview, Stone X
Trade EUR/CHF now: Login or Open a new account!
• Open an account in the UK
• Open an account in Australia
• Open an account in Singapore
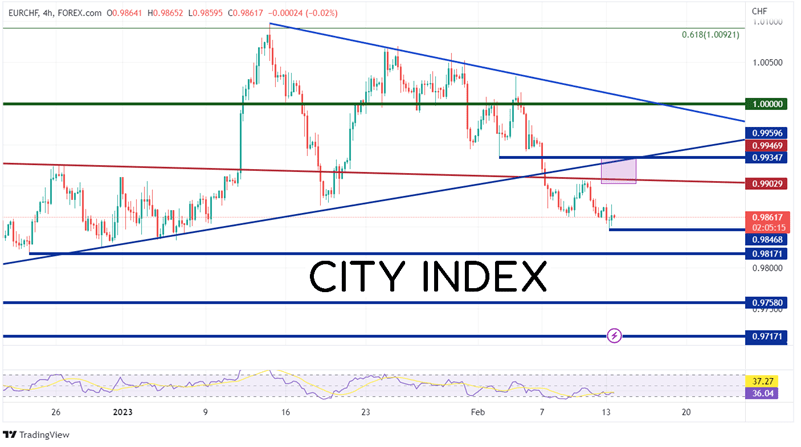
On a 240-minute chart, EUR/CHF broke above the top trendline of the symmetrical triangle and traded to a high of 1.0097 on January 11th. Since then, price has been making lower highs and higher lows as prices formed shorter-term symmetrical triangle. EUR/CHF broke below that triangle the same day as the others, February 7th, and continued lower making a low print on Monday at 0.9858. If price breaks below, there is additional horizontal support at 0.9817, 0.9758, and finally the lows from September 26th, 2022 at 0.9717. There is a large confluence of resistance above at both the 200-Day and 50-Day Moving Averages (see daily), the downward sloping trendline, the upward sloping trendline, and horizontal resistance, between 0.9902 and 0.9934. Watch for sellers to enter the markets around these levels. If price breaks through there, the next resistance is at the psychological round number of 1.0000 then the top trendline of the most recent symmetrical triangle at 1.0012.
Source: Tradingview, Stone X
CPI data for January from Switzerland was much stronger than expected. However, with the next SNB meeting not until March 23rd, the central bank will have another look at February's data before it makes its next decision on interest rates. However, if the next print is as strong as today’s print, the SNB might have to hike more than it would like!
Learn more about forex trading opportunities.