


A combination of weak earnings and housing data fanned concerns of stagflation in the world’s largest economy. Building permits – a leading indicator of economic health – fell -3.2% m/m, which was its weakest print since September. And to add to the fears was Target’s (TGT) profit warning which resulted in the stock plunging -25%. The Nasdaq fell over 5% for the second time since the pandemic and Wall Street was broadly lower.
Wage growth miss overshadows record unemployment for Australia
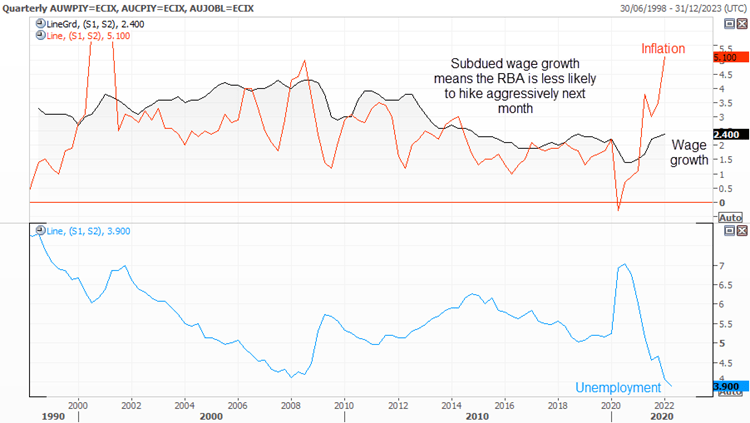
And this has put AUD/JPY back onto our radar. If we go back a couple of days there was hope that the RBA would hike by 40-bps. Yet softer-than-expected wage growth means this is now looking less likely and helps with potential bearish setups on AUD/JPY.
Yesterday’s wage data – which missed the mark – also removed some of the sparkle from today’s employment report. Which is a shame because unemployment hit a record low of 3.9%, even if headline employment underwhelmed. But ultimately, we do not think today’ report moves the needle much for the RBA.
It is wage growth that now needs to excel to convince the RBA that inflation will remain ‘sustainable’ and force them to hike more aggressively. Yesterday’s wage data miss means they’re more likely to raise by 25 bps, and not the 40-bps traders had hoped for.
What are economic indicators?
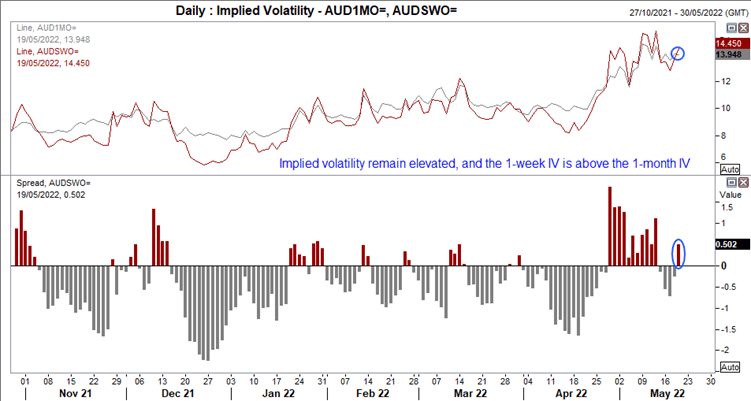
Implied volatility remains elevated for AUD pairs
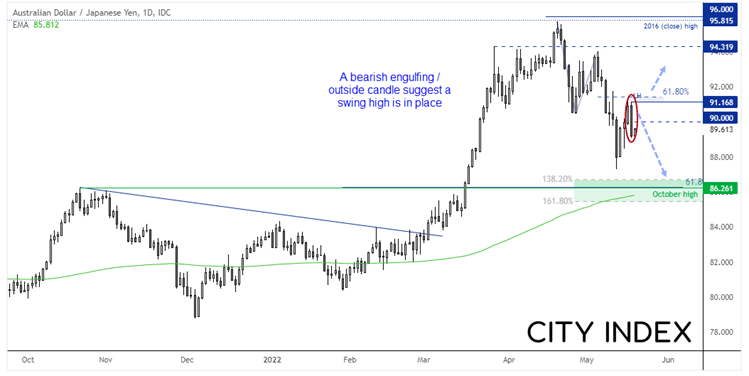
AUD/JPY daily chart:
We can see on the daily chart that AUD/JPY has seen a 3-wave move which began just beneath the 2016 high / 96.00. Yesterday produced a bearish engulfing (and outside) day to suggest a swing high is now in place, just below a 61.8% Fibonacci retracement level.
A wider trade deficit from Japan helped the yen to catch a bid today, so prices are now retracing within yesterday’s candle. Our bias remains bearish beneath yesterday’s high so looking to fade into such moves to increase the potential reward to risk ratio. Perhaps we’ll see a reversal pattern on an intraday timeframe around 90 which we could consider. At which point the initial target would be 88 (just above last week’s low) then down to the 88.50 area, near the October high, 200-day eMA and Fibonacci projection levels.
How to trade with City Index
You can easily trade with City Index by using these four easy steps:
-
Open an account, or log in if you’re already a customer
• Open an account in the UK
• Open an account in Australia
• Open an account in Singapore
- Search for the company you want to trade in our award-winning platform
- Choose your position and size, and your stop and limit levels
- Place the trade
Latest market news
Yesterday 01:23 PM
Yesterday 06:01 AM
April 18, 2024 11:27 PM
Latest Technical Analysis articles
April 15, 2024 07:13 PM
April 14, 2024 11:37 PM
April 13, 2024 08:00 PM
April 12, 2024 04:51 AM