


April 27, 2022 7:41 PM
The average 30-year mortgage rate for the week ending April 22nd rose to 5.37% from 5.2% the week prior. This was the highest level since 2009! In addition, mortgage rate applications for the same week fell by 8.3% vs a fall of 5% the week prior. This was the 7th week in a row that mortgage applications fell. These housing metrics are used as leading indicators for housing activity over the next few months.
Rising interest rates have already begun to hit the housing market as Pending Home Sales for March were down 1.2% vs down 4.1% in February. This was the 5th straight monthly decline. New Home Sales in March dropped 8.6% vs a drop of 1.2% previously. This was the 3rd consecutive monthly drop. Existing Home Sales fell by 2.7% in March vs -8.6% in February.
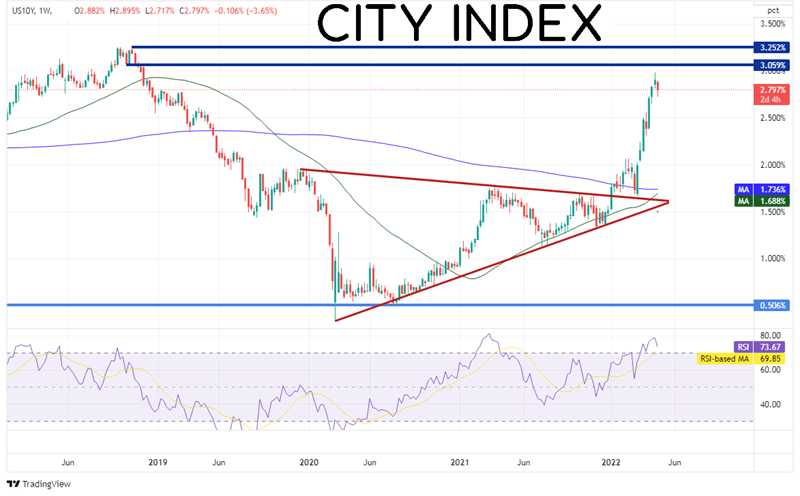
If long-term US interest rates continue to climb, then the housing market should continue to slow. This, along with inflation, reduces the purchasing power for people when buying large ticket items, such as a house. The current yield on the US 10-year Treasury is near 2.80%, just off its recent highs of 2.981% on April 20th. Notice that in just over 7 weeks, the key interest rate rose from 1.68% to 2.98%! The next resistance level is 3.059% and then the highs from November 2018 at 3.252%.
Source: Tradingview, Stone X
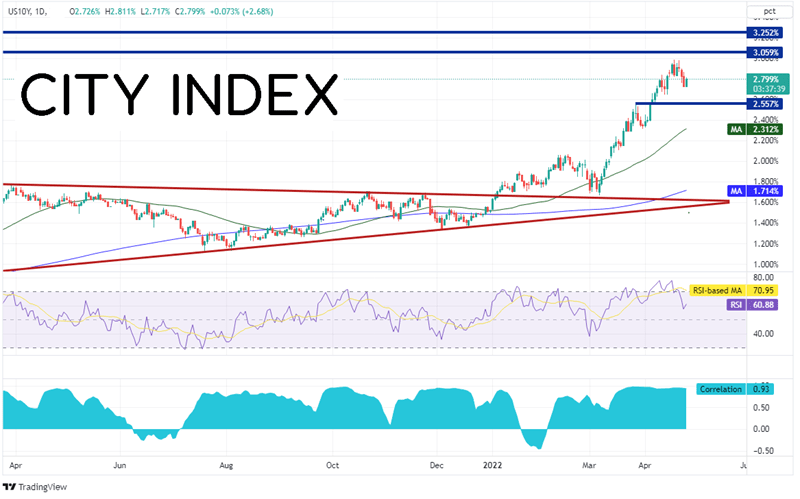
On a daily timeframe, there is support in 10-year yields at 2.557%, but then not until the 50 Day Moving Average at 2.312%. The bottom panel of the chart shows the correlation coefficient between 10-year yields and USD/JPY. The current reading is +0.93. Readings above +0.80 are considered to be strong correlations between 2 assets. Therefore, the correlation between USD/JPY and US 10-year yields is considered to be strong.
Source: Tradingview, Stone X
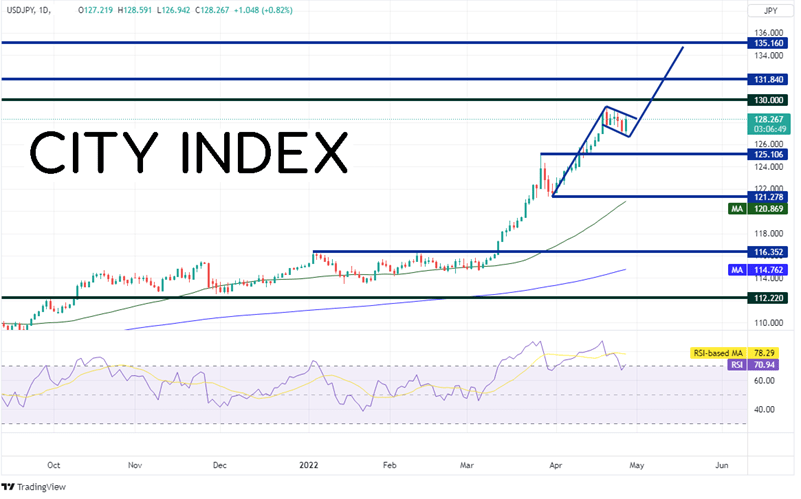
As one may have expected, USD/JPY has been racing higher with US 10-year yields. On a daily timeframe, price is currently consolidating in a flag pattern as the RSI pulls back into neutral territory. The price action for today’s candlestick is a bullish engulfing candle, in which today’s real body engulfs the real body of yesterday’s candlestick. This is considered to be bullish. If price does break higher, the target is near 134.75! However, price must first break through resistance at the psychological round number of 130, then horizontal resistance from 2002 at 131.84. If the flag pattern fails and USD/JPY moves lower, horizontal support sits at 125.10, then not again until 121.28.
Source: Tradingview, Stone X
Trade USD/JPY now: Login or Open a new account!
• Open an account in the UK
• Open an account in Australia
• Open an account in Singapore
Rising US yields are causing homebuyers to take pause and rethink their house purchase. In addition, due to the strong positive correlation between USD/JPY and 10-year yields, USD/JPY is moving higher. If yields move lower, watch to see if the housing market picks back up or if USD/JPY moves lower!
Learn more about forex trading opportunities.
Latest market news
Yesterday 01:23 PM
Yesterday 06:01 AM
April 18, 2024 11:27 PM
April 18, 2024 04:46 PM
Latest Forex articles
Yesterday 06:01 AM
April 17, 2024 02:40 PM
April 17, 2024 04:47 AM