


September 16, 2021 11:05 AM
Retail Sales strong beat; US Dollar bid continues
US Retail Sales for August was much stronger than expected, even with the lower revisions from July’s print. The headline print was +0.7% vs an expectation of -0.8%. However, the July number was revised lower from -1.1% to -1.8%, which nets to a 0.0% print for August (still better than expected). In addition, Retail Sales (ex-Autos) came in at 1.8% vs -0.1% expected. As with the headline number, July’s print was revised lower to -1.0% from -0.4%, which nets to a 1.2% for August (still much better than expected). This is good news for the US economy after the terrible print in July.
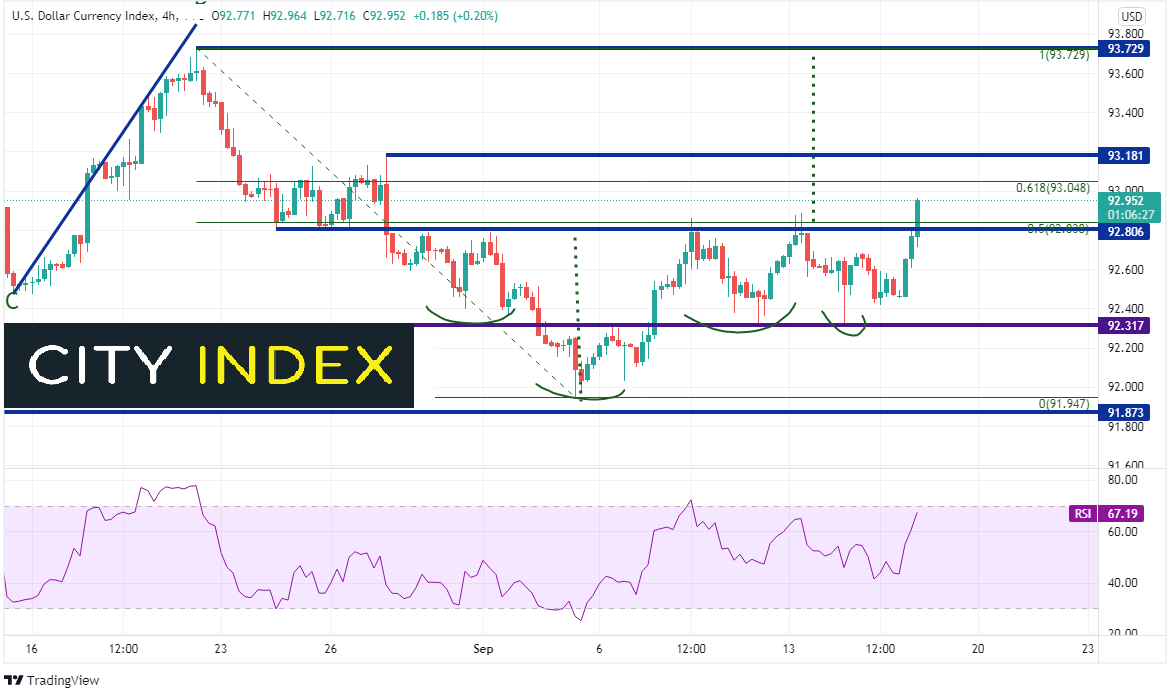
As has been the case for much of the last 1 ½ years, good news means a stronger US Dollar as it leads to stronger expectations that the FOMC will announce a taper at its meeting next week. The US Dollar had already been on a tear higher throughout the European session, and it continued after the Retail Sales data. On a 240-minute timeframe, the DXY has traded above previous highs and appears like it will close the current bar above 92.80, which is the neckline for an inverse head and shoulders pattern (with 2 right shoulders) and the 50% retracement level from the August 20th highs to the September 3rd lows.
Source: Tradingview, Stone X
What is the US Dollar Index (DXY)?
The target for the inverted head and shoulders pattern is near the August 20th highs of 93.72. However, if price is to reach the target, it must first pass through the 61.8% Fibonacci retracement level from the previously mentioned timeframe near 93.04, as well as previous highs from August 27th at 93.18. If the DXY falls back below 92.80, price can fall back to the day’s low near 92.46. Below there, horizontal support is at 92.31 and then the September 3rd lows at 91.95.
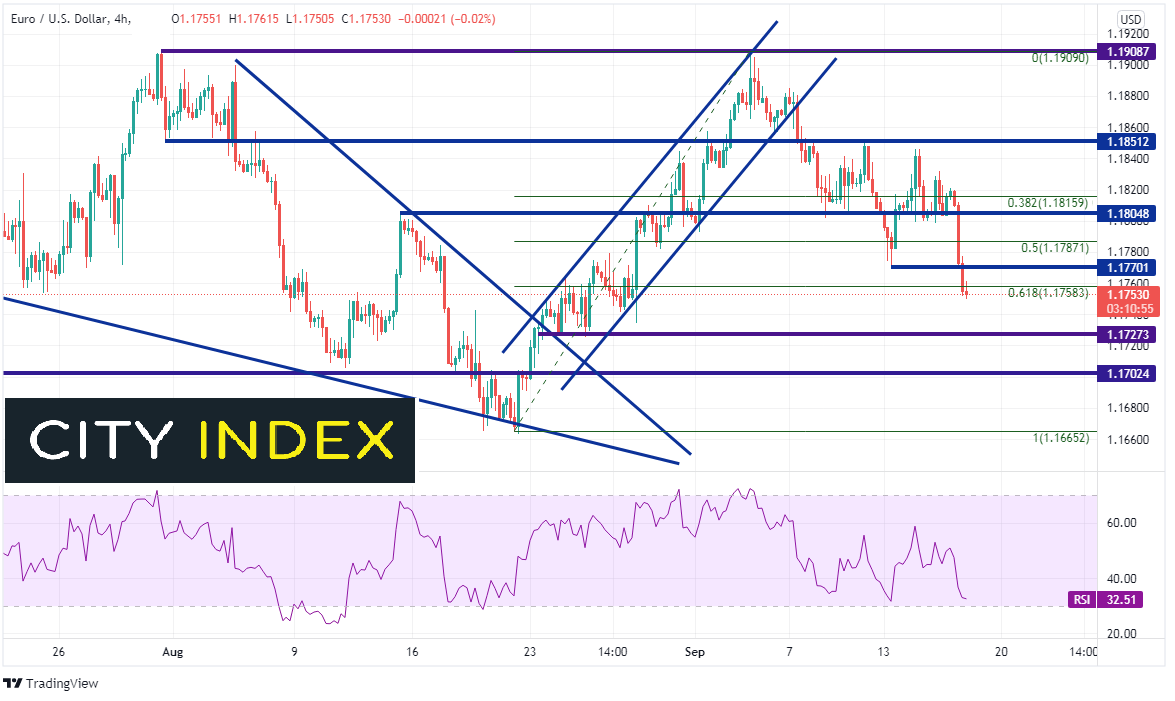
As one may expect, with the large move higher in the DXY today, EUR/USD is moving lower. (The Euro makes up 57.6% of the DYX). On the 240-minute timeframe, EUR/USD has broken through several important support levels today, including the 50% retracement and the 61.8% Fibonacci retracement from the August 20th lows to the September 3rd highs. If the pair is to continue moving lower towards the August 20th lows, it will first have to pass through horizontal support at 1.1727 and 1.1702. The RSI is nearing oversold levels and may be ready for an intraday bounce. Horizontal resistance above is at 1.1770 and 1.1804.
Source: Tradingview, Stone X
Trade EUR/USD: Login or Open a new account!
• Open an account in the UK
• Open an account in Australia
• Open an account in Singapore
Although we had much stronger than expected Retail Sales today, the US Dollar had already been going bid since the European session. This morning’s data just gave a boost to the already strong performance on the day. Traders may be positioning themselves for ahead of the FOMC meet week, just in case they announce tapering. EUR/USD acts inversely to the DXY, therefore watch for a reversal in the DXY for a signal that EUR/USD may reverse as well.
Learn more about forex trading opportunities.
Latest market news
Today 08:33 AM
Latest DXY articles
April 10, 2024 11:24 PM
April 8, 2024 03:35 AM
April 4, 2024 10:28 PM
April 3, 2024 02:35 AM