


October 28, 2021 5:13 PM
The Advanced look at Q3 GDP for the US was only 2% vs 6.7% in Q2. And although economists expected the economy to slow to 2.7% due to supply chain issues and the Delta variant of the coronavirus, the headline print was even worse than expected. In addition, the GDP Price Index (or the deflator) was a lofty 5.7% vs 5.5% expected, although it was lower than the 6.2% print from Q2. So, we still have high and persistent inflation and lower growth, or STAGFLATION. However, given that it is already the end of the 1st month of Q4, the data is stale, and markets are not likely to trade on it. With decreases in the coronavirus and supply chain issues expected to be resolved over the next year, GDP moving forward is expected to increase.
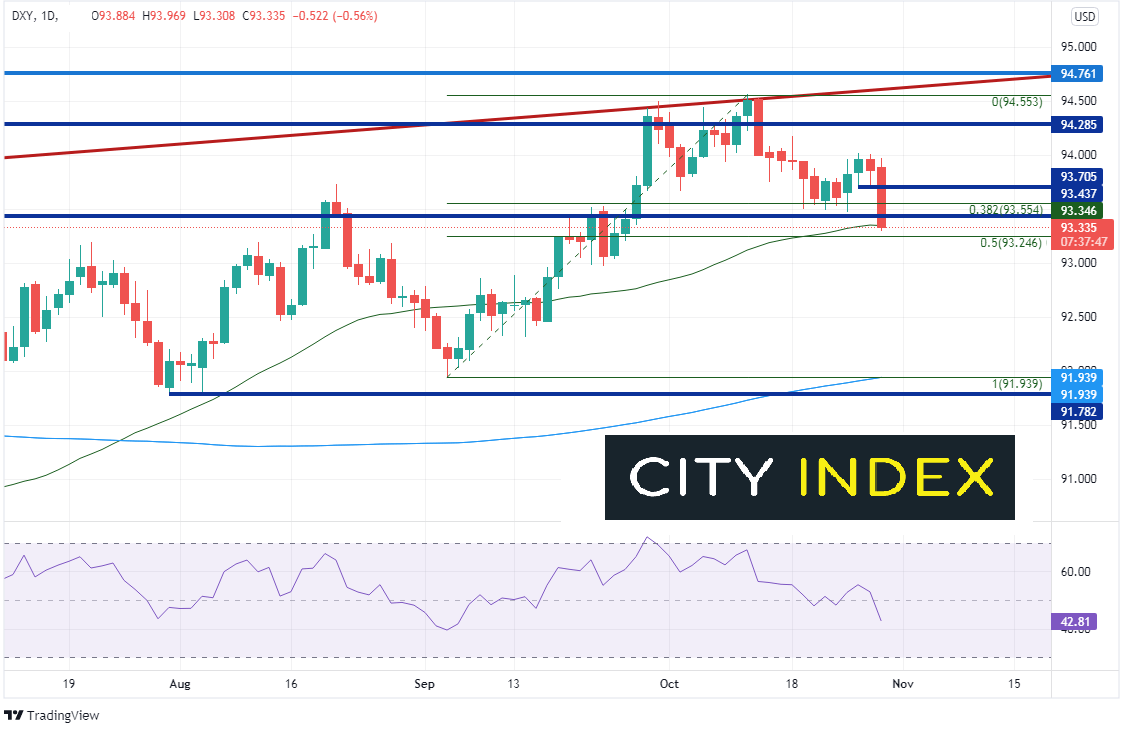
As mentioned, the GDP data is stale and therefore, markets didn’t move much on its release. However, soon after the GDP release was the press conference for the ECB’s Monetary Policy meeting, which caused the US Dollar to pull back. The DXY has broken through a large support zone at the 38.2% Fibonacci retracement from the lows of July 30th to the highs of October 12th, previous highs, and the 50-Day Moving Average between 93.43 and 93.55. Note that the DXY hasn’t traded below the 50-Day Moving Average since September 16th! The next level of support is the 50% retracement level from the same time period at 92.24. Resistance now comes in at the previous support level at 93.44, the October 26th highs at 94.02, horizontal resistance from March 31st at 94.28, and highs at 94.56 on October 12th.
Source: Tradingview, Stone X
Trade NZD/USD now: Login or Open a new account!
• Open an account in the UK
• Open an account in Australia
• Open an account in Singapore
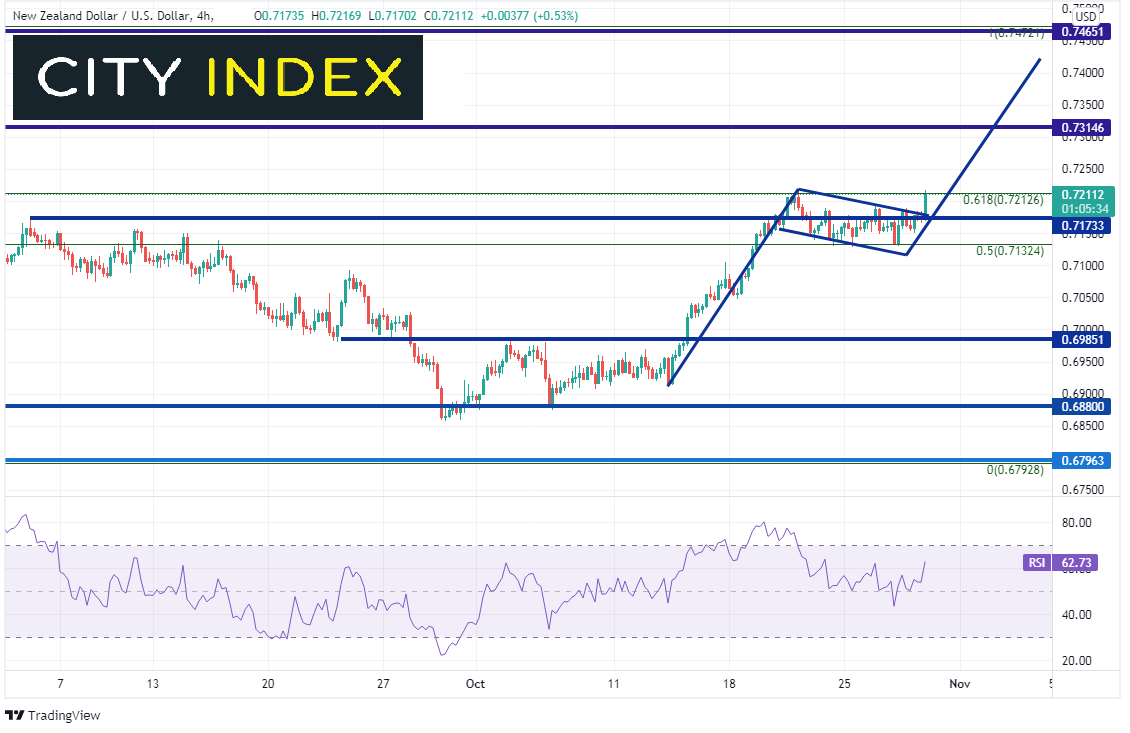
With the US Dollar Index moving lower today, most of the US Dollar pairs are moving higher. NZD/USD had been rallying aggressively since mid-October and stalled at horizontal resistance and the 61.8% Fibonacci retracement from the highs on February 26th to the lows on September 29th at 0.7213. The pair had been consolidating near that level since October 21st and formed a flag pattern. With the move lower today in the US Dollar, NZD/USD broke higher out of the flag and is testing the 61.8% Fibonacci level once again. The target for the flag pattern is near 0.7420. The only significant resistance level in the way of reaching the target is horizontal resistance at 0.7315, which was a series of prior highs dating back to March 2nd. Support is at the top trendline of the flag near 0.7173 and then the bottom trendline of the flag near 0.7115.
Source: Tradingview, Stone X
Today’s weak Q3 GDP was a sign that the coronavirus had taken its toll on supply chains everywhere. In addition, the Delta variant hampered Q3 growth. However, both issues are expected to ease heading forward and growth should pick up once again in Q4 and in 2022.
Learn more about forex trading opportunities
Latest market news
Today 08:33 AM
Latest Trade Ideas articles