


March 21, 2022 6:18 PM
Fed Chairman Powell sent a signal to the markets today that the Fed would be aggressive on interest rates if they must. Speaking at the Nation Association for Business Economics (NABE), Powell said that “if the Fed needs to tighten above neutral rate, will do so.” When asked what would prevent a 50bps move in May, Chairman Powell responded with “Nothing”. In addition, he noted that at the next FOMC meeting, the Fed will begin unwinding its balance sheet as “we are not expecting near-term progress on inflation”. These are the most hawkish comments yet by Powell, and the markets noticed.
Everything you need to know about the Federal Reserve
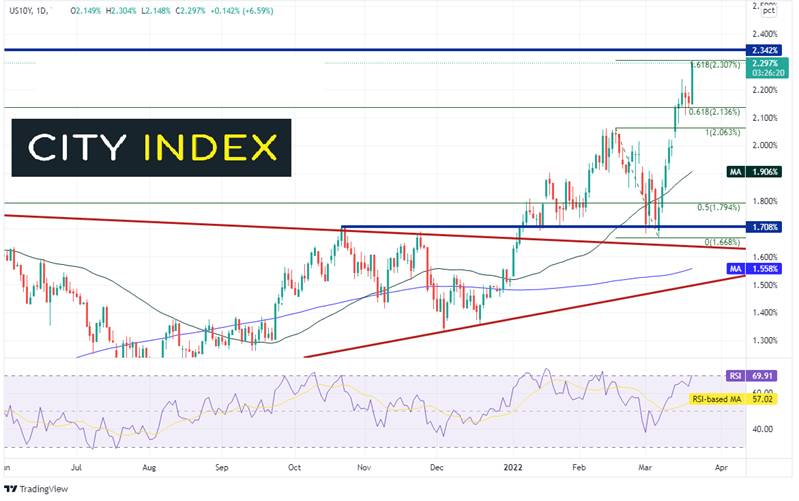
The comments sent yields screaming. The 10-year yield broke aggressively above the 61.8% Fibonacci retracement from the highs of November 2018 to the low of March 2020 near 2.136%. As of the time of this writing, 10-year yields have reached a high of 2.304%, its highest level since May 2019. This is also the 161.8% Fibonacci extension from the highs of February 16th to the lows of March 7th. Horizontal resistance sits just above at 2.342%. Support is at today’s low of 2.148%.
Source: Tradingview: Stone X
Trade USD/JPY now: Login or Open a new account!
• Open an account in the UK
• Open an account in Australia
• Open an account in Singapore
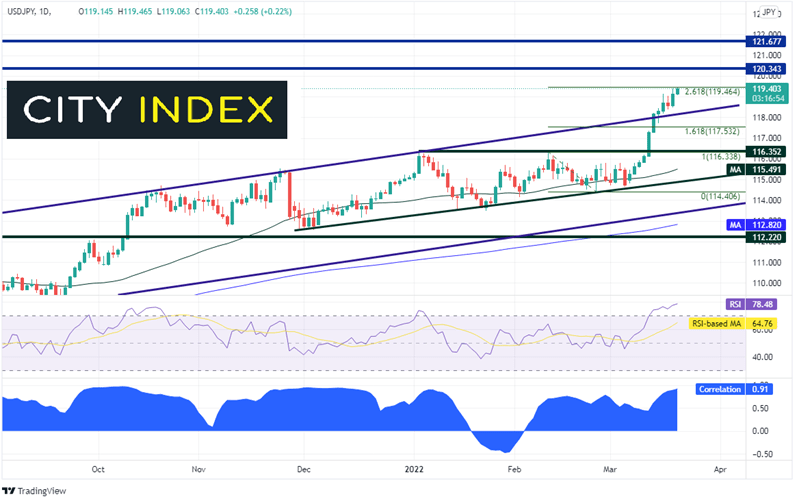
As a result of the move higher in yields, USD/JPY has moved higher as well. The correlation has come back in line between yields and USD/JPY, with a current correlation coefficient of +0.91. A correlation coefficient of +1.00 is a perfect positive correlation and means that the 2 assets move in the same direction 100% of the time. A reading above +0.80 is considered a strong correlation. (The correlation in early March was under +0.80). USD/JPY has moved to its highest level in 6 years, reaching the 261.8% Fibonacci extension from the highs of February 10th to the lows of February 24th, near 119.46. First resistance is at the psychological round number of 120.00, then horizontal resistance from 2016 at 123.34 and 121.68. First support is at the top trendline of the channel the pair had been in since late 2020, near 118.17. Below there, USD/JPY can fall to the February 10th highs of 116.34, then the 50 Day Moving Average at 115.49.
Source: Tradingview, Stone X
In Powell’s first comments since the press conference after the FOMC meeting last week, he comes across as extremely hawkish. These comments are in addition to hawkish comments from Bullard and Waller late last week. Continue to watch the tape for headlines. It seems that the Fed may be willing to take inflation head-on!
Learn more about forex trading opportunities.
Latest market news
Today 07:49 AM
Today 04:24 AM
Yesterday 10:48 PM
Latest Trade Ideas articles
Today 07:49 AM
Today 04:24 AM

Yesterday 10:48 PM