


July 21, 2022 5:08 PM
While the ECB may have hiked interest rates by 50bps this morning, the July Philadelphia Fed Manufacturing Index showed that the US economy may be slowing. The headline print for the large manufacturing district was -12.3 vs an expectation of 0 and a previous print of -3.3. Components leading the headline print lower were Employment (19.4 vs 28.1 last) and Prices Paid (52.2 vs 64.5 last). Regarding employment, it should also be noted that the initial claims print for the week of ending July 16th was 251K, the highest level since February. Today’s employment data may be giving a signal as to where the jobs data is headed. Regarding inflation, today’s prices paid component shows that perhaps US inflation is beginning to slow, as the print declined for the 3rd month in a row to its lowest level in over 1 year.
The US Dollar Index had been moving aggressively higher as it became more and more apparent that the Fed would have to hike rates as inflation continued to rise. The DXY broke above the upward sloping channel on April 14th, near 100.13, and hasn’t been back inside since then. The index continued to move higher in an ascending wedge formation. Expectations are that price will break lower out of an ascending wedge, however, in this case the US Dollar Index continued to move higher out of the wedge, near 106.50, as there was talk of the possibility of the Fed hiking 100bps when it meets next week. However, the DXY could only move to a high of 109.29 on July 14th, before pulling back as the RSI was in overbought territory. Price is currently holding support at the top trendline of the ascending wedge and the 38.2% Fibonacci retracement level from the lows of May 30th to the highs of July 14th, between 105.80 and 106.25.
Source: Tradingview, Stone X
Trade DXY now: Login or Open a new account!
• Open an account in the UK
• Open an account in Australia
• Open an account in Singapore
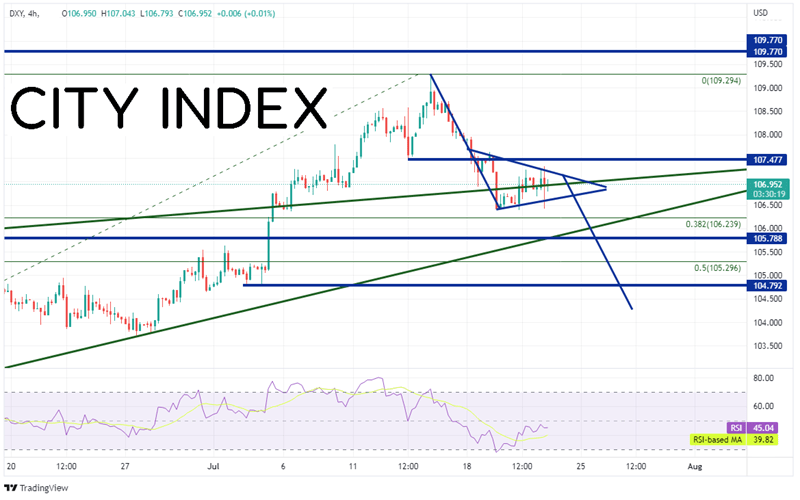
On a 240-minute timeframe, we can see that the DXY is trading at an important level. In the shorter timeframe, the US Dollar Index is consolidating inside a pennant formation. Pennants are typically continuation patterns, which indicates price should breakout to the downside in this case. If that does happen, it will mean price had a false breakout to the topside of the ascending wedge (on the longer timeframe) and should move to test the bottom trendline of the pattern. First support below the 38.2% Fibonacci retracement mentioned on the daily timeframe is horizontal support at 105.80. Below there, price can move to the 50% retracement from the same timeframe near 105.30, and then additional horizontal support at 104.79. However, if the support holds and price moves higher, first horizontal resistance is near 104.50. Above there, the DXY can move all the way to the highs from July 14th near 109.24 and then 109.77, which are the highs from September 2002!
Source: Tradingview, Stone X
The Philadelphia Fed Manufacturing Index was weaker than expected, pointing to the possibility of a slowdown. The Employment component and the Prices Paid component were big contributors to the weaker print. Could we be seeing the first signs of a slowing jobs market and lower inflation? Markets will get a chance to see what Fed members think when they meet next week!
Learn more about forex trading opportunities.