


June 24, 2022 3:57 PM
The Bank of Mexico (Banxico) hiked rates by 75bps from 7% to 7.75% during its June interest rate decision meeting. This is the 9th hike in the cycle, which began in June of last year and is the highest interest rate level since October 2019. This came hours after Mexico released its June mid-month Inflation rate at 7.88% YoY vs 7.7% YoY expected and up from 7.58% YoY in May. In addition, the mid-month Core inflation rate was 7.47% YoY vs 7.3% YoY expected and 7.24% YoY previously. These numbers are still well above the central bank’s target inflation rate of 3.0%. The primary reason for raising rates was due to increasing inflationary pressures and tighter monetary pressures worldwide. Banxico also raised its inflation forecast peak from 7.6% in Q2 2222 to 8.1% in Q3 2023, while at the same time maintaining its convergence to the 3% target rate in Q1 2024. In addition, as with many other central banks, Banxico said it will take act forcefully if needed.
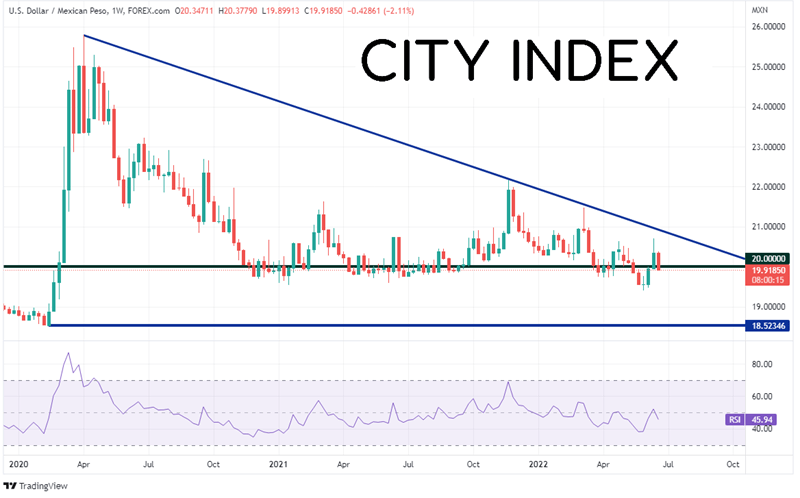
On a monthly timeframe, as the coronavirus pandemic began in early 2020, USD/MXN rose from 18.5235 to a high of 25.7836 during the week of April 6th, 2020. Since then, the pair has been moving lower in a series of lower highs. However, USD/MXN has bounced each time it has fallen to the 20.0000 area. The pair is currently nearing the apex of the descending triangle. Will it finally break?
Source: Tradingview, Stone X
Trade USD/MXN now: Login or Open a new account!
• Open an account in the UK
• Open an account in Australia
• Open an account in Singapore
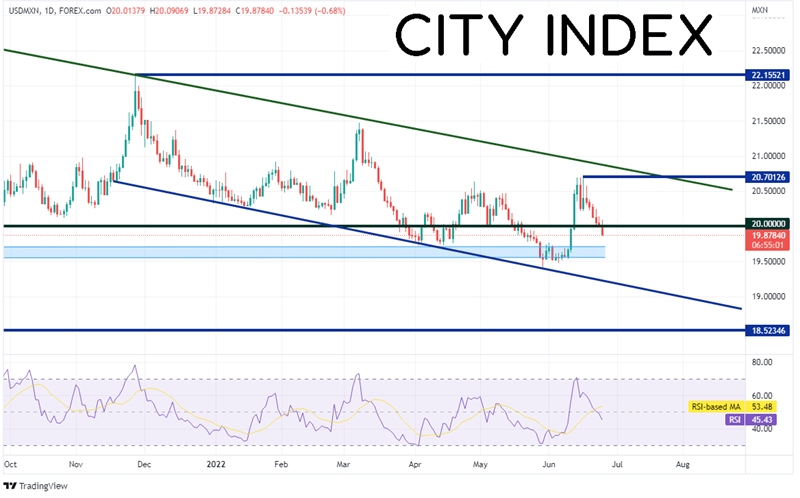
On a daily timeframe, USD/MXN has been moving lower in an orderly channel since late November 2021. Price reached its lowest levels since March 2020 on May 30th at 19.4136, testing the bottom of the support zone where price has held below 20.000. USD/MXN then bounced back above 20.0000, reaching a high of 20.7012 on June 16th. Since then, price has been moving lower, and once again cracked below the 20.0000 line.
Source: Tradingview, Stone X
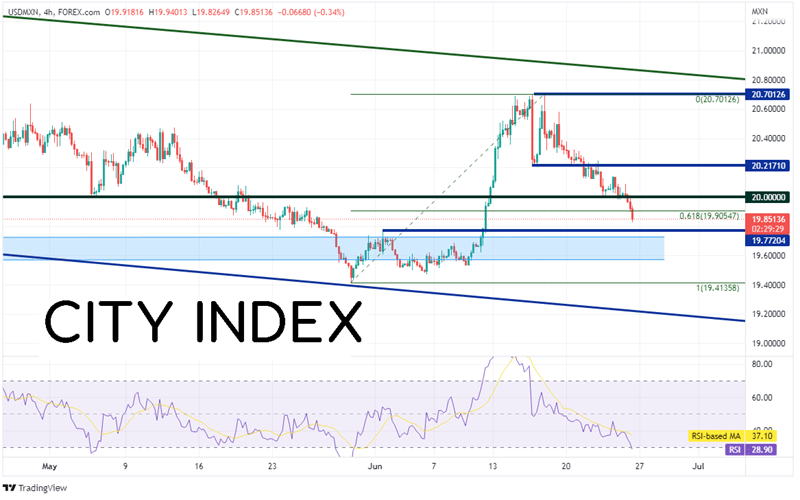
On a 240-minute timeframe, USD/MXN has recently broken below the 61.8% Fibonacci retracement level from the lows of May 30th to the highs of June 16th , near 19.9055. If price is to continue lower, it must first pass through horizontal support at 19.7720, then a range of long-term support between 19.7282 and 19.5734. Below there, price can trade to the lows of May 30th at 19.4135. However, notice that the RSI is in oversold territory, an indication that USD/MXN may be ready for a bounce. If the support holds and USD/MXN goes bid, first resistance is at the psychological round number of 20.0000. Above there, price can move to price can move to horizontal resistance near 20.2171, then the highs of June 16th at 20.7012.
Source: Tradingview, Stone X
Banxico hiked interest rates yesterday by 75bps, matching that of the US 2 weeks ago. Earlier in the day, mid-month inflation came in hotter than expected. As a result, USD/MXN has continued its long term move lower, once again cracking the key 20.0000 level. Will it continue lower? It may depend on whether the central bank decides to hike another 75bps at its August meeting!
Learn more about forex trading opportunities.