


June 8, 2022 8:21 PM
The National Bank of Poland hiked rates by 75bps on Wednesday to bring the benchmark interest rate from 5.25% to 6%, as expected. It was the 9th consecutive hike for the central bank, which brought rates to the highest level since November 2008. Unsurprisingly, inflation was the main reason for the interest rate hike as the country deals with rising prices in energy and other commodities due to the Russia/Ukraine war. Poland released its preliminary May inflation reading on May 31st, which was 13.9% YoY vs 12.4% YoY in April! This was the highest reading since October 1997. The final CPI reading is due on June 15th. The central bank also recognized that the pace of economic growth will slow in Q2, but said overall conditions remain favorable due to low unemployment and higher wages. For reference Q1 2022 GDP was 8.5%.
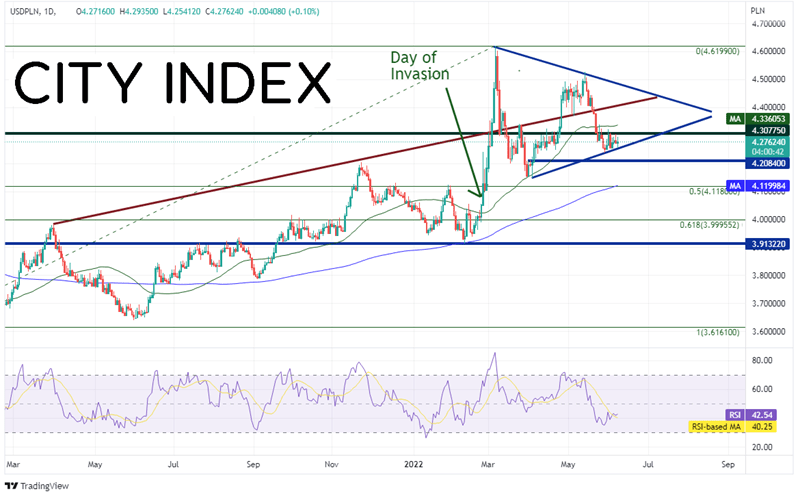
USD/PLN had already been moving higher before the Russian invasion of Ukraine. On December 17th, 2020, the pair made a low print of 3.6161. However, by the time of the invasion, the pair was trading near 4.0505. Over the course of the next 6 trading sessions, USD/PLN took out previous all-time highs near 4.3078 and moved as high as 4.6199. The pair then pulled back and held just above the 50% retracement level from the lows of December 2020 to the highs of March 7th, 2022. Since then, USD/PLN has been oscillating around an upward sloping trendline dating to March 31st, 2021. In doing so, price has formed a symmetrical triangle.
Source: Tradingview, Stone X
Trade USD/PLN now: Login or Open a new account!
• Open an account in the UK
• Open an account in Australia
• Open an account in Singapore
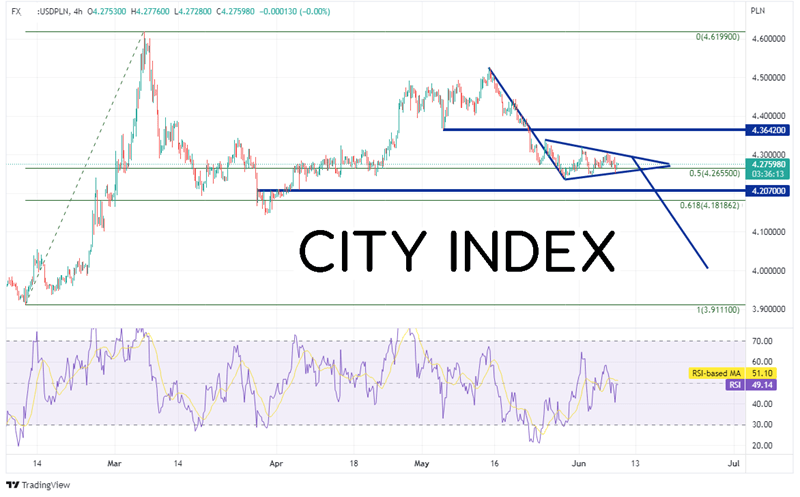
On a 240-mionute timeframe, USD/PLN is sitting near the 50% retracement level from the lows of February 10th to the highs of March 7th, near 4.2655. In addition, on the shorter timeframe, the pair has formed a symmetrical triangle of its own. Interestingly, this triangle targets the downside near 4.000. However, on the daily timeframe, the symmetrical triangle targets a break to the upside. Perhaps price will post a false break lower, then a resumption to the trend to the upside? First support is at the bottom trendline of the triangle (which is also the bottom of the triangle on the daily chart) near 4.2454, then horizontal support near 4.207. If price breaks below, 4.1819 is the 61.8% Fibonacci retracement level from the February 10th low to the March 7th highs. First resistance is at the top, downward sloping trendline of the triangle near 4.2995, then the 50 Day Moving Average at 4.3361 (see daily). If price trades above there, it can move to a confluence of resistance at the long-term upward sloping trendline (see daily in red) and the lows of May 4th, near 4.3642.
Source: Tradingview, Stone X
The NBP hiked rates 75bps, as expected, as it tries to fight off inflation from rising commodity prices. As for USD/PLN, the daily timeframe shows that the pair is in a symmetrical triangle and may break to the upside. However, on the shorter 240-minute timeframe, the pair is in a symmetrical triangle which looks like it may break to the downside. Which timeframe will be right? Generally, longer timeframes tend to hold levels better than shorter ones.
Learn more about forex trading opportunities.
Latest market news
Yesterday 01:23 PM
Yesterday 06:01 AM
April 18, 2024 11:27 PM
April 18, 2024 04:46 PM
Latest Trade Ideas articles

April 18, 2024 11:27 PM
April 18, 2024 04:46 PM