


October 18, 2022 8:21 PM
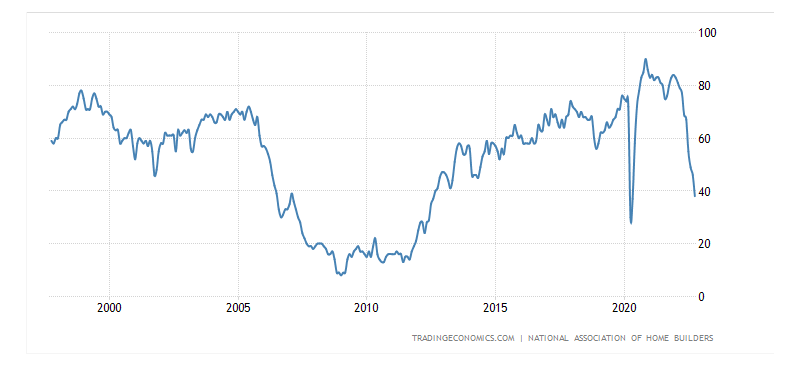
The National Association of Home Builders (NAHB) Housing Market Index for October was 38 vs an expectation of 43 and a September print of 46. This was the tenth straight monthly decline. With exception to the spring of 2020 when the coronavirus had much of the world on lockdown, this was the lowest reading since August 2012! Current sales conditions fell to 45 from 54, sales expectations over the next 6 months fell to 35 from 46 and traffic of perspective buyers fell to 25 from 31! The primary reason for the overall drop was due to higher interest rates combined with high housing prices. For reference, the MBA 30-year Mortgage Rate was 6.81% last week, the highest since June 2006. Notice in the chart below the similar rate of decent between the mid-2000s and now. If this number continues to drop at the same pace, it may be foreshadowing a recession. And why shouldn’t it continue to fall? If inflation continues to rise, mortgage rates should continue to rise as well.
Source: Trading Economics
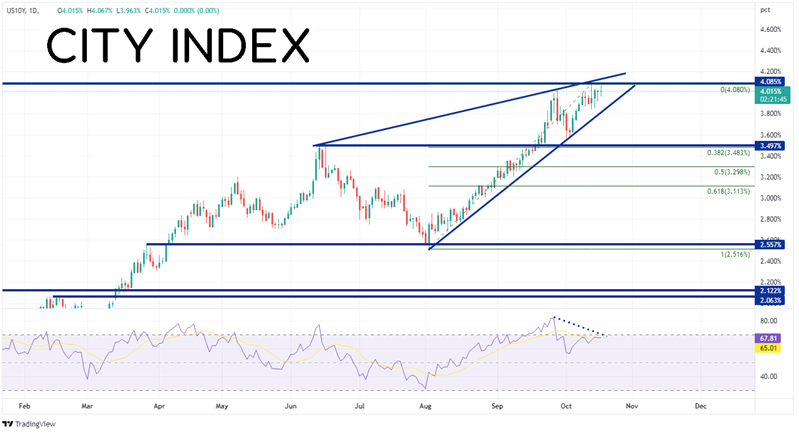
However, there is room for a pullback in 10-year yields. The benchmark yield has been rising in a wedge formation since August 2nd. Yields are not only approaching the apex of the wedge, but also the highs from October 2008 at 4.085%. If yields break above, the next level of resistance is at the top trendline of the wedge and the 127.2% Fibonacci extension from the highs of June 16th to the lows of August 2nd near 4.14%. Above there, yields can move to the 161.8% Fibonacci extension from the same timeframe and the highs from December 2007 near 4.29%, The third level of resistance is the November 2007 highs at 4.47%.
Source: Tradingview, Stone X
Trade US Bonds now: Login or Open a new account!
• Open an account in the UK
• Open an account in Australia
• Open an account in Singapore
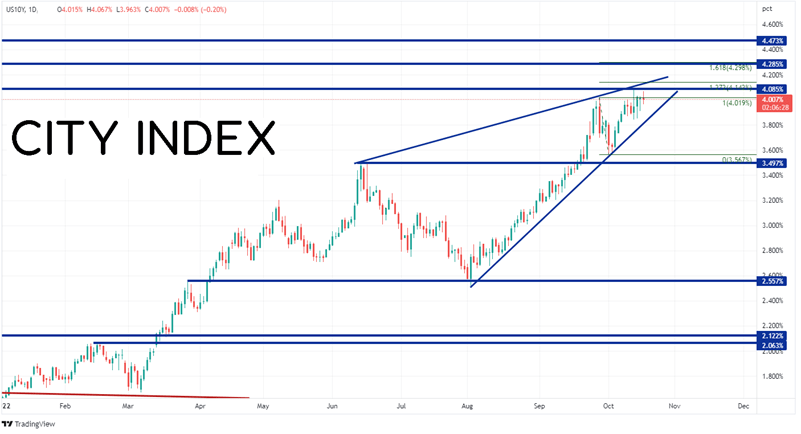
However, notice that yields are diverging with the RSI, an indication that yields may be ready to pull back. If the resistance holds, first support is at the bottom trendline of the wedge near 3.85%. Below there, yields can fall to the 38.2% Fibonacci retracement from the lows of August 2nd to the highs of October 13th at 3.48%, which is also near horizontal support mid-June. The next support level is the 50% retracement near 3.30%.
Source: Tradingview, Stone X
In the mid-2000’s, the NAHB Housing Market Index dropped dramatically, similar to what is happening today. Could this be a foreshadowing of a recession? With the Fed continuing to raise rates, yields on longer-term bonds should rise as well. But for right now, 10-year yields are diverging with the RSI and running into resistance. Perhaps they pull back first.
Learn more about forex trading opportunities.
Latest market news
Today 11:14 AM
Today 08:28 AM
Yesterday 03:30 PM
Latest Trade Ideas articles

Today 11:14 AM
Yesterday 11:00 AM
Yesterday 08:15 AM