


April 7, 2021 5:09 PM
Mexican inflation expected to heat up
Mexico’s inflation data for March is expected to tick higher when the print is released tomorrow morning. The headline Inflation Rate is expected to increase from 0.63% to 0.83% MoM and the annualized rate is expected to increase from 3.76% in February to 4.67% in March. A few hours afterwards, the Minutes from the March 25th Bank of Mexico (Banxico) interest rate meeting will be released. At that meeting, the central bank left rates unchanged at 4.0% as expected, however members said they felt inflation will be slightly higher than previously forecast. Mexico’s annual inflation for the first half of March was 4.12%, however Banxico targets 3%. If tomorrow’s inflation data is much higher than expected, will the central bank be forced to raise rates at their next meeting after a long easing cycle? Since the March 25th meeting the Mexican Peso has strengthened vs the US Dollar, as USD/MXN fell from 20.9548 down to yesterday’s lows of 20.1410.
What is the time of day to trade forex?
USD/MXN has been moving lower in a descending wedge since the Spring of 2020. On February 18th, the pair broke higher and pushed its way through the 200 Day Moving Average on March 4th, near 21.20. USD/MXN reached a high of 21.6355 on March 8th, just below the 38.2% Fibonacci retracement level from the April 6th, 2020 highs to the January 21st low near 21.9351. The inability of price to overcome this retracement level, as well as, hold above the 200 Day Moving Average indicates the bounce out of the wedge may have been corrective.
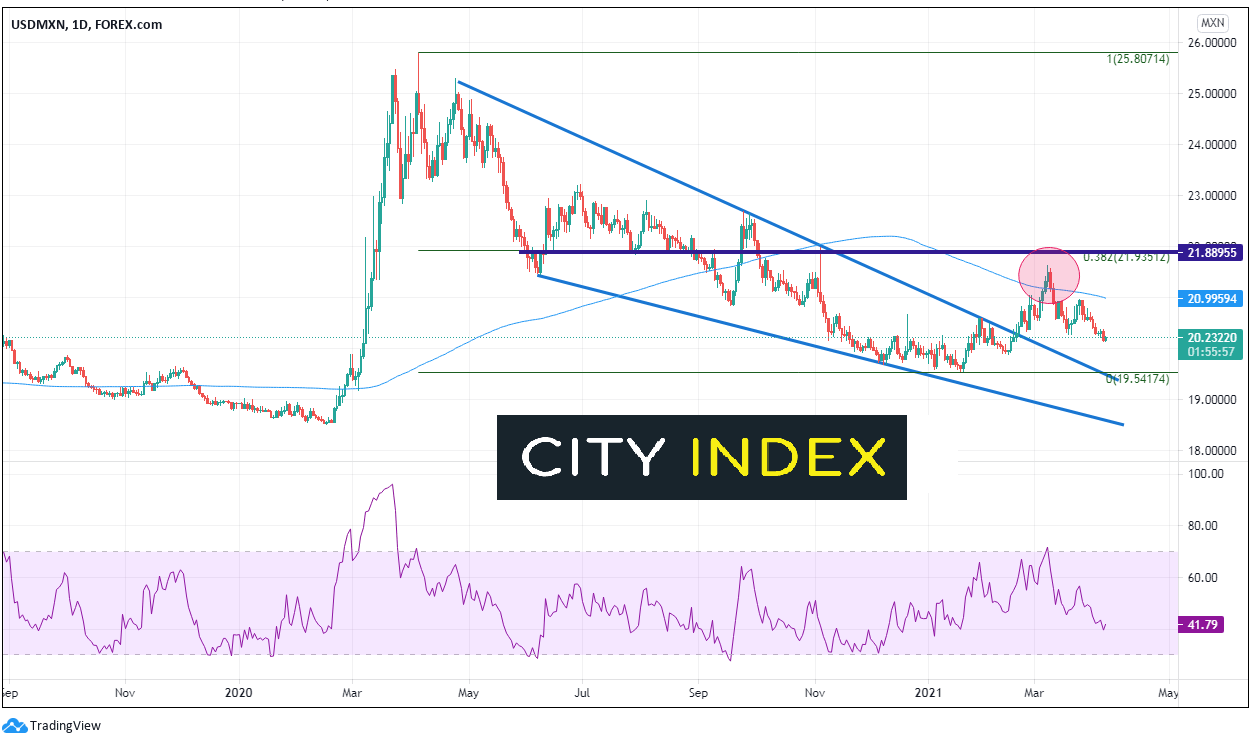
Source: Tradingview, City Index
On a 240-minute timeframe, after breaking out of the wedge, USD/MXN formed a head and shoulders pattern and broke below the neckline on April 1st. After a few attempts to break back above, price failed and moved lower. The price target for a head and shoulders pattern is the distance from the head to the neckline, added to the point where the neckline is broken. In this case it is near 18.9325! However, price must first break through the confluence of support from the January lows and the top downward sloping trendline of the long-term wedge (see daily chart) near 19.5491. The next level of support is the psychological round number at 19.00. Resistance is back at the neckline of the head and shoulders pattern, near 20.4046. The next level of resistance is the top of the right shoulder near 20.9696, and then the 200 Day Moving Average near 20.9959 (see daily chart), which confluences with the psychological round number resistance at 21.000.
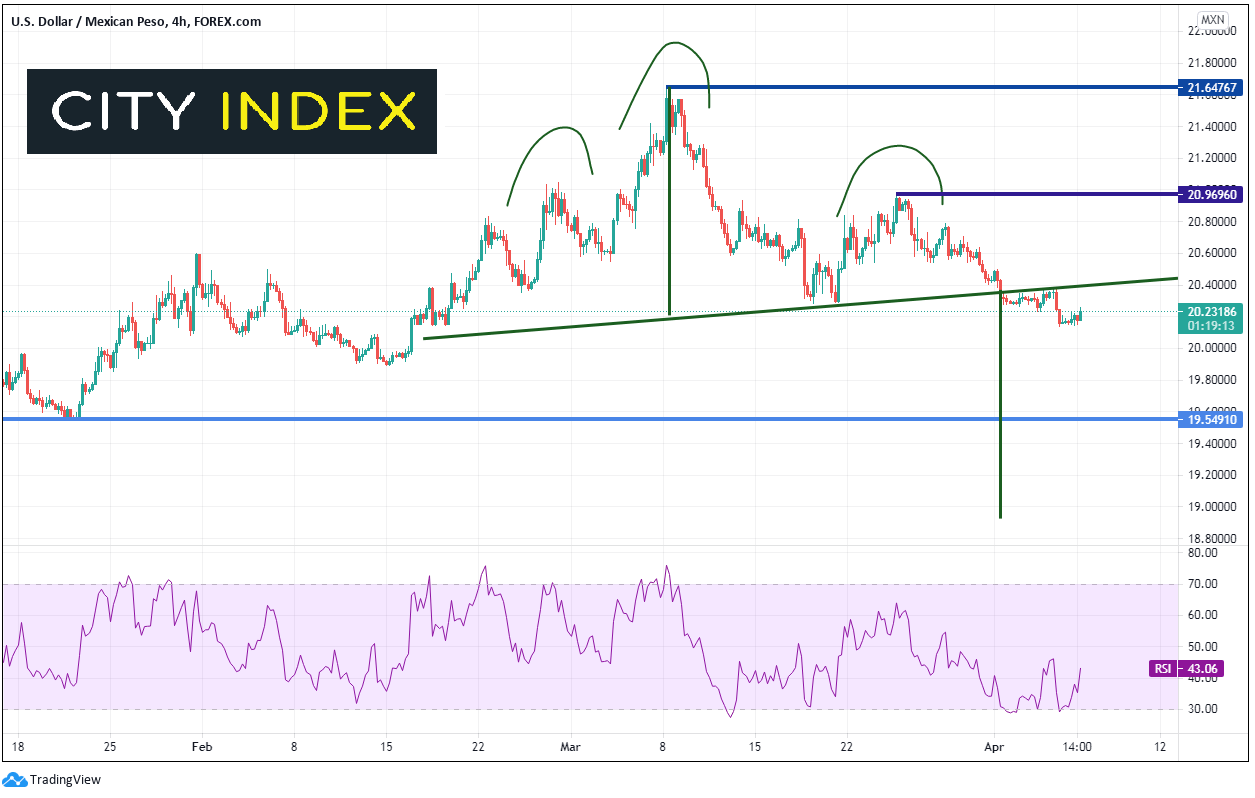
Source: Tradingview, City Index
As Banxico is concerned about a rise in near-term inflation, tomorrow’s inflation data will be closely watched by traders. If it is much stronger than expected, USD/MXN may continue moving lower. If the inflation data is weaker, bears may be looking to take advantage of a bounce and continue pushing the pair lower.
Learn more about forex trading opportunities.
Latest market news
Latest Forex articles

April 17, 2024 02:40 PM
April 17, 2024 04:47 AM