


November 1, 2022 6:02 PM
The US released some important beginning of month data earlier, namely the ISM Manufacturing PMI for October, which came out at 50.2 vs 50 expected and 50.9 last. The New Orders and Employment components were both stronger, while the Prices component fell to 46.6 from 51.7. However, markets turned their collective attention to the second-tier data that was released at the same time as the ISM data. JOLTS, Job Openings and Labor Turnover Survey, showed that the number job vacancies in the US rose by 437,000 to 10,720,000! The previous reading was 10,200,000.
This is the last piece of jobs data that the Fed will see before it releases its decision on Wednesday as to how much it should raise interest rates. The question surrounding the JOLTS data isn’t necessarily regarding Wednesday’s announcement. The Fed has well-choreographed its intention to raise 75bps, which would raise the Fed funds rate to 4%. The question now turns to, “Will they even discuss a 50bps, or a pivot, for the December meeting”? With a JOLTS print showing job vacancies are abundant, will the Fed hint that it is ready to pivot? If anything, the JOLTS print will give the Fed the confidence to continue hiking rates. Markets may now have to wait until Friday’s Non-Farm payrolls print to get a better idea of what the Fed may do at its December meeting.
Everything you need to know about the Federal Reserve
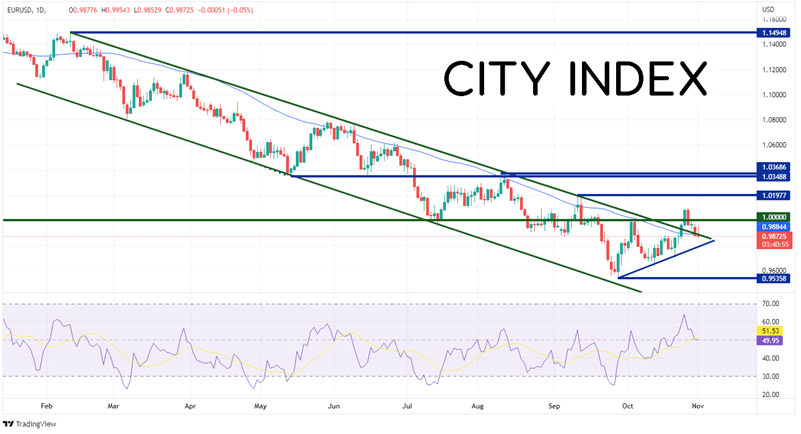
As a result of the higher than expected JOLTS data, the US Dollar has moved higher as traders become more concerned that the pivot won’t be looking to pivot in December. EUR/USD has been moving lower in an orderly channel since February 10th when the pair was trading near 1.1500. EUR/USD made a local low on September 28th, near the bottom trendline of the channel at 0.9536, and bounced. On October 25th, the pair broke above the top trendline of the channel and the 50 Day Moving Average reaching a high of 1.0080 on October 26th. Since then, the pair has pulled back. With the US Dollar strength today, EUR/USD is now testing support at the top trendline of the channel and the 50 Day Moving Average near 0.9884.
Source: Tradingview, Stone X
Trade EUR/USD now: Login or Open a new account!
• Open an account in the UK
• Open an account in Australia
• Open an account in Singapore
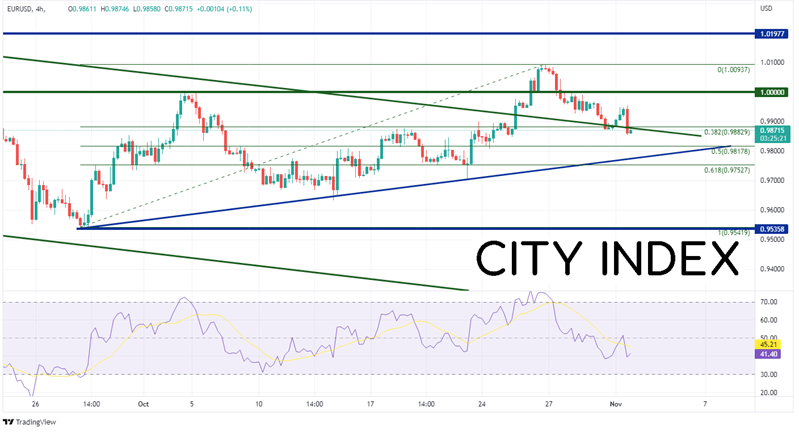
On a 240-minute timeframe, EUR/USD has already pulled back to the 38.2% Fibonacci retracement level from the lows of September 28th to the highs of October 26th near 0.9883. If the pair continues to move lower, the next support level is the 50% retracement level from the same timeframe at 0.9818, then an upward sloping trendline from the September 28th lows near 0.9773. If price breaks below there, the next support level is the 61.8% Fibonacci retracement level from the previously mentioned timeframe at 0.9753. However, if the support holds and EUR/USD bounces higher, the first resistance is the psychological round number level of 1.0000. Above there, the next resistance level is at the highs from October 26th at 1.0094, then the highs from September 12th (see daily timeframe) at 1.0198.
Source: Tradingview, Stone X
The JOLTS figure today shows that the US has even more job vacancies than anticipated, which was already high. This should give the Fed confidence in raising rates by 75bps tomorrow. However, many are expecting the FOMC to discuss “only” hiking 50bps at the December meeting. Does today’s jobs data change that? Some think it could and they took the US Dollar bid. However, we’ll have to wait until tomorrow’s FOMC release to find out for sure!
Learn more about forex trading opportunities.