


February 27, 2020 3:58 PM
Japan Economic Data will be Watched by “Everyone”
In a few hours, Japan will release economic data, and everyone will be watching! For the last 20 years (roughly), Japan has thrown good money after bad in attempts in push inflation higher. When Japan releases economic data, many don’t even pay attention as it can’t be good enough, or bad enough, to move markets. That may have changed on February 16th when Japan released the Annualized Premilitary Q4 GDP Growth Rate at -6.4%. The data was expected to be poor at -3.7% due to a new sales tax and the typhoon, but not this bad. As often is the case, USD/JPY wasn’t affected by the data. However, a few days later, the largest pension fund in the world (GPIF) began selling Yen and buying US Dollars and Euros, among other currencies. Granted, Japan has other worries right now due to the coronavirus, such as closing schools and determining if Tokyo will hold the Summer Olympics, however this will be the first look at January data to see if the extremely poor data trend has continued. Below is a list of the data dump for later:
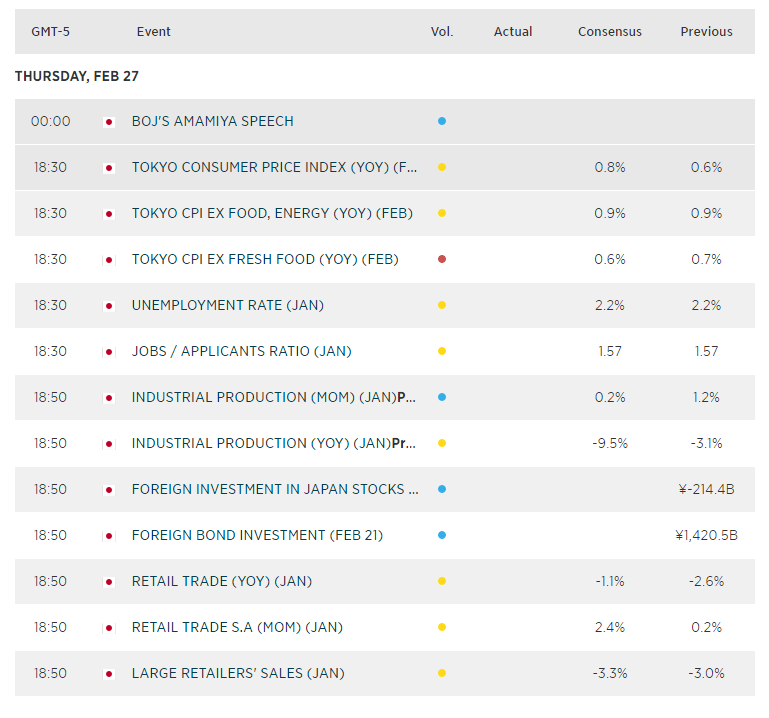
Source: City Index
On a weekly timeframe, 2 bars furthest to the right are last week’s price action and this week’s price action. Last week has a long white bar. Japanese officials pushed USD/JPY higher out of the symmetrical triangle the pair has been in since mid-2015. It also broke above the upward sloping channel the pair has been in since mid-2019. Were they looking for stops? Who knows? But USD/JPY halted its thrust higher at the 50% retracement level from the highs of mid-2015 to the lows of a year later in mid-2016, near 112.22. This week, we see a long dark bar forming as yen was bought back in a “flight to safety” move. As fears mounted over the coronavirus this week, USD/JPY has traded back to the 110.00 level, trading +/- 30 pips of that level.
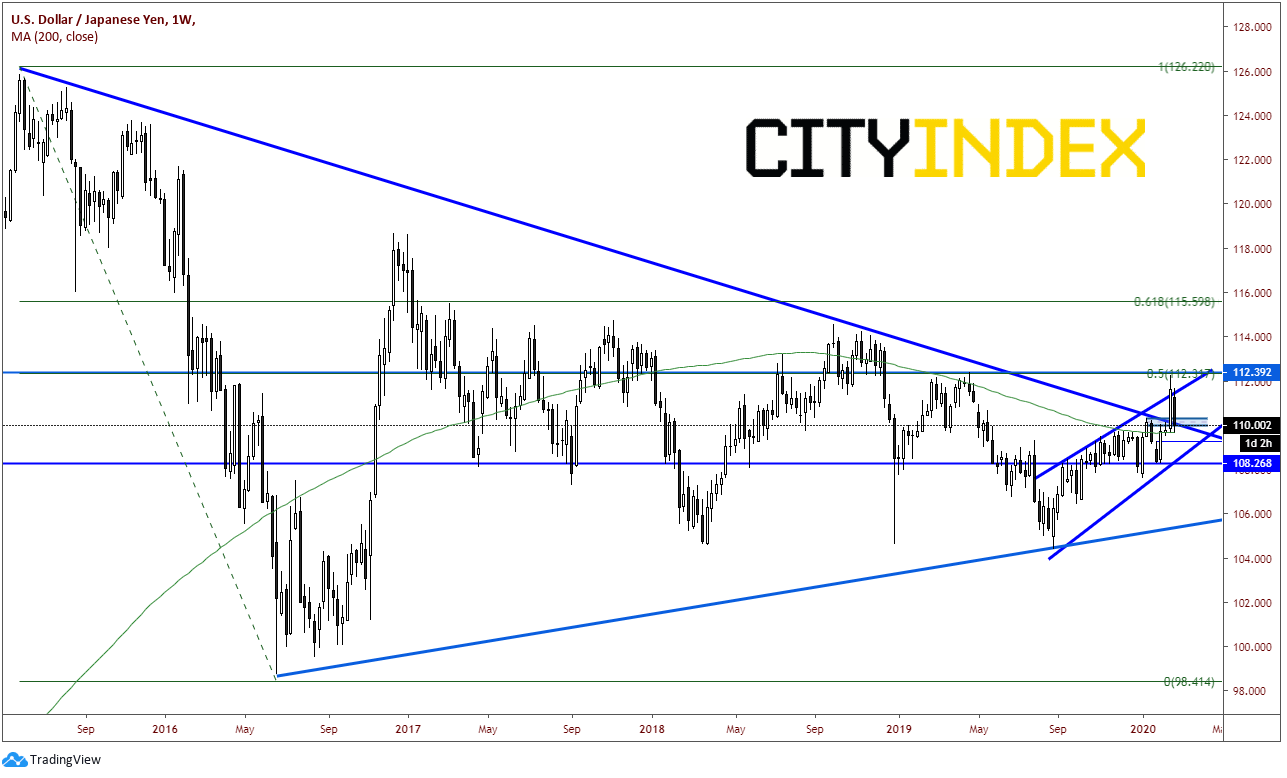
Source: Tradingview, City Index
Interestingly, as stocks markets have dived some 10% this week (the blue line chart), USD/JPY has only fallen back to the level where the Japanese officials began selling Yen on February 19th. Notice the correlation coefficient at the bottom. On February 18th, the correlation coefficient was +.92. For reference, a correlation coefficient of +1.00 means that they 2 assets are perfectly correlated, moving in lockstep together. The correlation coefficient today is +.17. This means that although still positive, there is barely any correlation between the two assets. A correlation coefficient of 0 means there is no correlation at all.
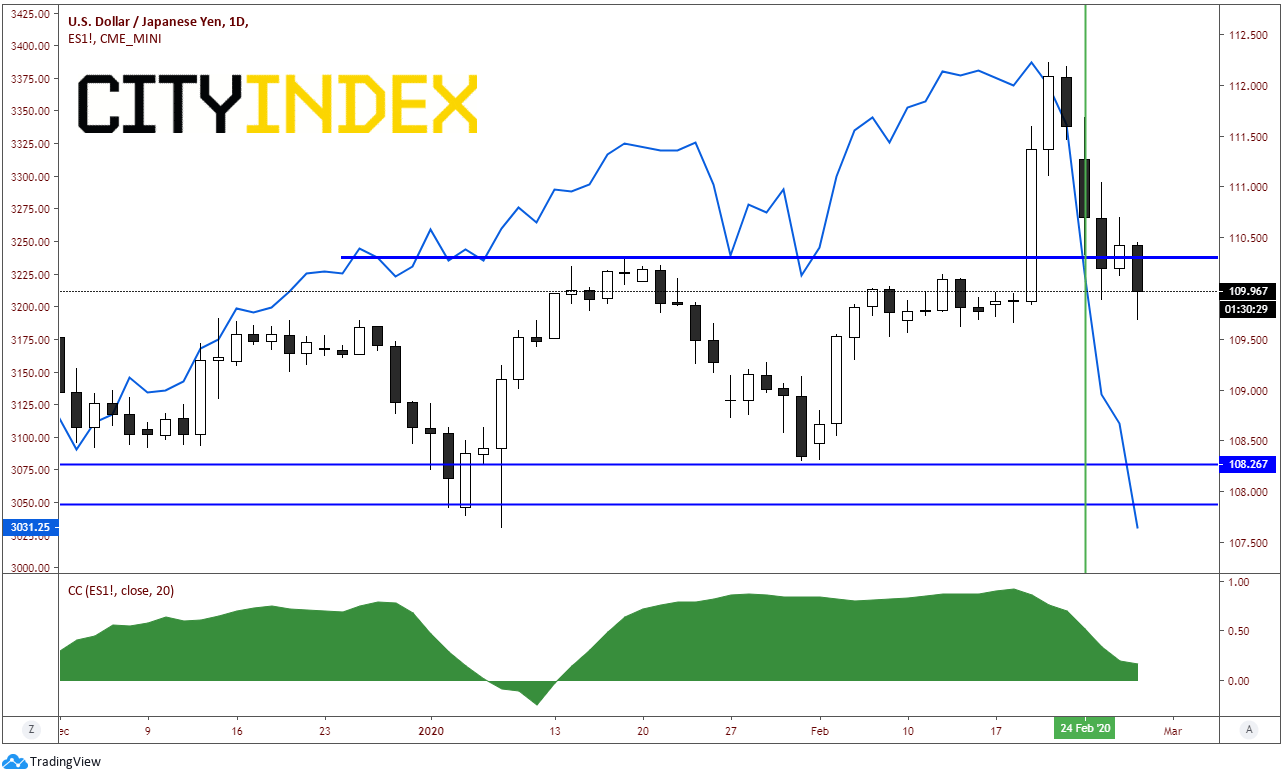
Source: Tradingview, CME, City Index
What does this mean? Traditionally, as risky assets (stocks) are sold off, the “flight to safety” asset (yen) should be moving higher (USD/JPY lower). But that isn’t happening. There must be some big buyers of USD/JPY near the 110 level!! Will that change after the data is released in a few hours? If the data is poor again, it could mean more of a flight to safety (oddly enough, even if it is the Japanese Yen), and we may see more Japanese official buying to stem the bleeding. Or perhaps it will take containment of the coronavirus to support USD/JPY?
Having said that, if stocks reverse and move higher, watch for an even more aggressive move higher in USD/JPY as both traders and Japanese officials will be buying (keep on eye on the correlation coefficient to give you a better idea of how aggressive the move is).
Latest market news
Yesterday 01:23 PM
Yesterday 06:01 AM
April 18, 2024 11:27 PM
April 18, 2024 04:46 PM
Latest Dollar articles
April 18, 2024 06:20 AM
February 16, 2024 11:30 AM
February 7, 2024 03:30 PM
February 2, 2024 02:00 PM