


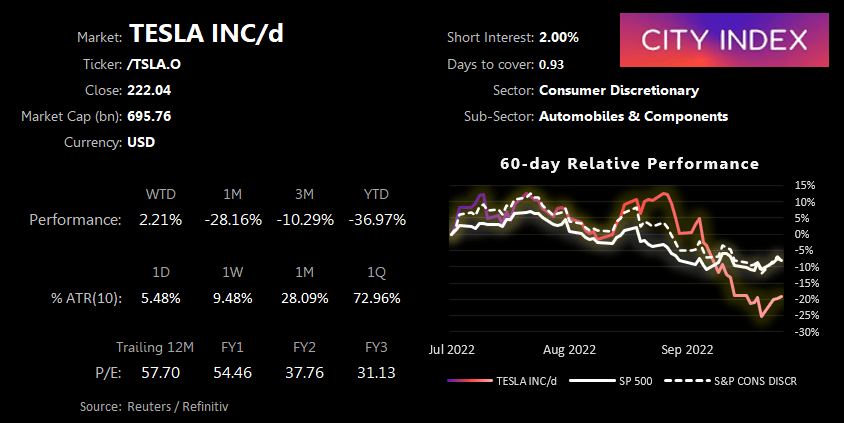


- Tesla shares fell around -7% after the close following their mixed Q3 earnings report.
- Reported revenue was $21.45bn compare with $22.09bn estimated, and adjusted EPS was $1.05 compared with $1.01 estimated.
- Raw material inflation was a factor which impacted their profitability, whilst operating income was negatively impacted by unfavourable currency moves.
- Battery supply chain issues are also likely to remain a limiting factor to the EV market over the medium-to-long term.
Tesla shares were lower after their mixed earnings report, which is likely a combination of traders booking profits from the small pre-earnings bounce in a classic case of ‘buy the rumour sell the fact’. But who knows, perhaps investors are tiring of Elon Musk’s showmanship remarks, which today included expectations of a “record breaking Q4” and the potential for “Tesla to be worth more than Apple and Apple and Saudi Aramco combined”. And it is hard not to be suspicious of the timing of such remarks looking at their YTD performance of -37% and him conceding that he’s overpaid for Twitter (but still “very excited”).
But let’s keep is simple and look at a potential multi-month reversal pattern on the monthly chart, and Tesla’s potential to break lower this week.
A history of Tesla year by year
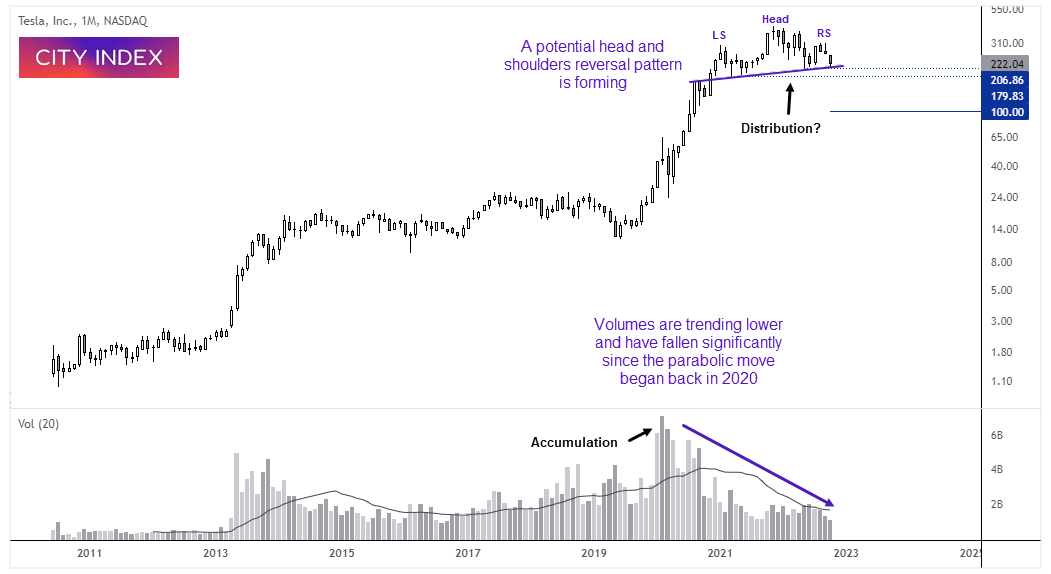
Tesla (TSLA) monthly chart:
Sometimes you really need to stand back to admire the view, and the monthly Tesla chart is no exception. Given it has risen over 22,000% since the stock was listed (and over 3,400% since the 2019 low alone) the Y-axis has been converted to logarithmic scale.
A couple of things really stand out. Volume peaked in February 2020 and has trended significantly over the past three years. Moreover, volume has been below average these past four months as buyers continue to lose steam. A head and shoulders reversal pattern is also in the making, with prices currently finding support around the neckline. If we used a standard chart the H&S pattern would measure a target around -$50 (yes, minus) but the logarithmic chart projects a move around $100 – which is roughly half of where is currently trades, and more realistic.
Whether we see the break lower or not may take time to come to fruition, given it is a weekly chart, but it is certainly a pattern to keep an eye on regardless.
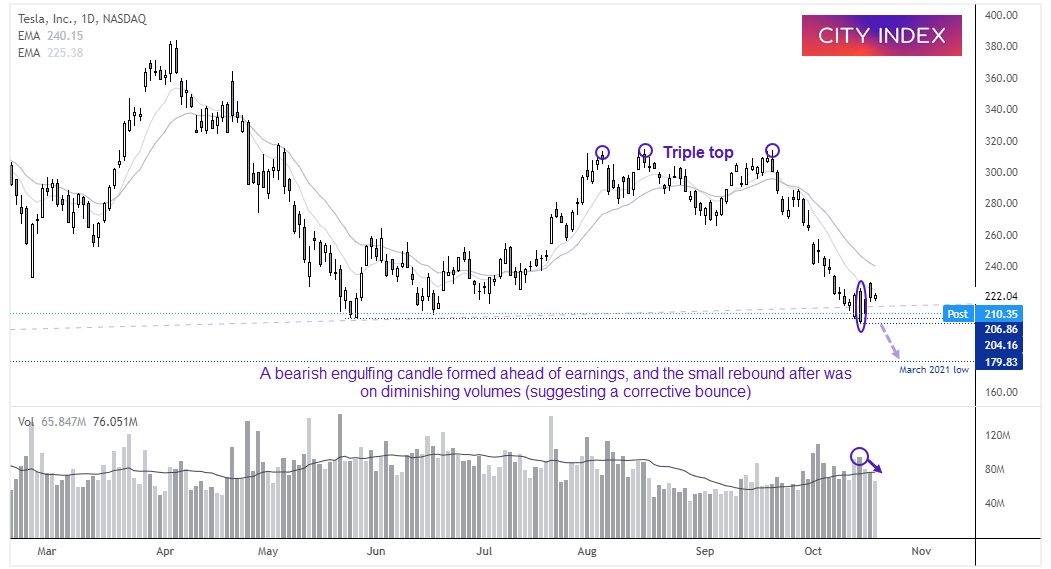
Tesla (TSLA) daily chart:
A triple top formed around $315, and Tesla has trended lower on the daily chart since. We saw an initial false break of the neckline last week with a bearish engulfing candle on high volume. But notice how volumes have again diminished over the past three days whilst prices bounced higher, which suggests it is a retracement.
Tesla has fallen to 210.35 during post-market trade, which is just above the bearish engulfing low. We are therefore simply looking for a break below $204 (or $200 for a more conservative approach) to assume a bearish breakout, with $180 making a logical target for bears as it is near the March 2021 low.
Given the significance of the March 2021 low then there is a strong possibility it will initially act as support. But keeping the monthly chart and reversal pattern in mind, the bias is for an eventual break below $179.83.
How to trade with City Index
You can easily trade with City Index by using these four easy steps:
-
Open an account, or log in if you’re already a customer
• Open an account in the UK
• Open an account in Australia
• Open an account in Singapore
- Search for the company you want to trade in our award-winning platform
- Choose your position and size, and your stop and limit levels
- Place the trade
Latest market news
Yesterday 01:23 PM
Yesterday 06:01 AM
April 18, 2024 11:27 PM
April 18, 2024 04:46 PM
Latest Trade Ideas articles

April 18, 2024 11:27 PM
April 18, 2024 04:46 PM