


Well, it obviously depends on the data, doesn’t it? But it is not all about today’s CPI print and the immediate reaction to the data won’t necessarily be a precursor for future trends in the markets.
Anyway, headline CPI is seen cooling to 8.1% year-over-year in April from 8.5% previously, with core CPI expected to print 6.0% compared to 6.5% in March. On a month-over-over-month basis, headline and core CPI estimates are expected to print 0.2% and 0.4% respectively.
Peak inflation
There’s a lot been said about the US potentially hitting “peak inflation,” which may explain why traders have taken their feet off the gas in the last couple of days, allowing equity indices and government bond prices to stabilise a little, while the dollar has cooled off a tad.
There are 3 main considerations to take into account after the CPI data is released.
- First, the possibility of inflation coming in slightly weaker today may increase those “peak inflation” talks, which is why traders are taking no chances ahead of the publication of the data. A weaker CPI print may lead to some strength in downbeat tech stocks and gold, and weigh on the dollar. However, will one month’s worth of data matter? As I mentioned, it may do in the eyes of short-term traders, so we may well see a sharp reaction if the data does come in weaker than expected.
- Second, what about beyond the short-term reaction to any weakness in CPI? I reckon investors will then wonder how quickly inflation will fall back towards more normal levels. There are no major leading indicators to suggest it will fall very quickly. If anything, we may see inflation remaining elevated for a long period of time instead. So, at best, the hope is that it will start to cool off slowly, due above all to the base effect, but prices won’t go down fast or much. Against this backdrop, I wouldn’t expect to see a major improvement in risk appetite. Indeed, we may even see a
- Third, let’s not forget that there is a risk that instead of weakening price pressures, CPI will come in hotter. If that’s the case, all those “peak inflation” hopes will be dashed, and we could see a sharp sell-off in stocks and other risk assets as the dollar and bond yields resume higher.
All told, I don’t expect to see a major reversal in the trends today. As such, I maintain a moderately bearish outlook towards equities due to central bank tightening, neutral towards gold and silver, and slightly bullish on the dollar.
EUR/USD stuck between a hard place and rock
Above, I wrote ‘slightly’ bullish on the dollar because much of the Fed’s future tightening is already priced in. But with some of the other major central banks, including the ECB, not so keen to tighten its belt fast or very tightly, and given the ongoing Ukraine situation the outlook weighing on economic activity in Europe, the EUR/USD remains bearish for now.
Here’s a weekly chart of the EUR/USD:
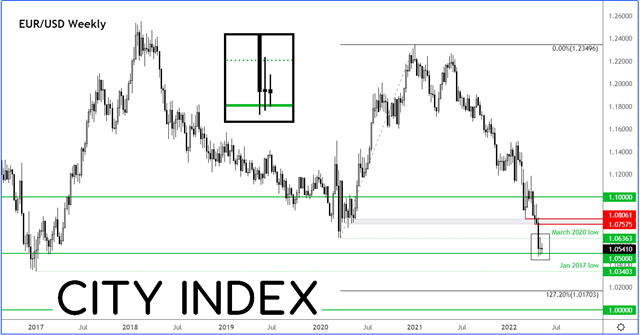
Source for all charts used in this article: StoneX and TradingView.com
After breaking the March 2020 low at around 1.0635 at the back end of April, the EUR/USD spent the first week of May consolidating below this level. It formed a small doji candle there, as dip buyers attempted to defend the psychologically-important 1.05 handle but lacked conviction to cause a reversal in the bear trend. The doji candle points to indecisiveness, which is hardly a surprise after the Fed talked down the prospects of 75 basis point rate hikes and ahead of the publication of the CPI data.
Nevertheless, the trend remains bearish and a clean break below 1.05 could see the EUR/USD take out the January 2017 low at 1.0340 next, and maybe even go lower.
The bulls on the other hand will need a lot of wood chopping before they can take control of short-term price action. If they manage to push rates back above the March 2020 low, this would be a welcome sign for them, although they will then face further resistance around 1.0755 to 1.0805 range, an area which was previously support. Only a decisive break above 1.0805 would be deemed a bullish technical breakthrough, for that will completely undo the most recent breakdown.
Whether the abovementioned first line of support (~1.05) or resistance (~1.0635) breaks may be determined by the publication of Wednesday’s US CPI report.
How to trade with City Index
You can trade with City Index by following these four easy steps:
-
Open an account, or log in if you’re already a customer
• Open an account in the UK
• Open an account in Australia
• Open an account in Singapore
- Search for the company you want to trade in our award-winning platform
- Choose your position and size, and your stop and limit levels
- Place the trade
Latest market news
Yesterday 03:30 PM
Yesterday 01:23 PM
Yesterday 11:00 AM
Yesterday 08:15 AM
Latest Trade Ideas articles
Yesterday 11:00 AM
Yesterday 08:15 AM
Yesterday 05:45 AM