


September 7, 2022 8:40 PM
The Bank of England meets on Thursday next week and markets are pricing in a 75bps hike to bring the overnight rate to 2.50%. With expectations of such a large rate increase, one may expect that GBP/USD would be much higher. However, today the pair has broken the lows from March 2020 near 1.1411, making a low of 1.1405. Poor manufacturing data and the energy crunch are mostly to blame, as well as a strong US Dollar. However, the most recent inflation report showed that the headline CPI is 10.1% YoY. Of course the BOE needs to raise rates aggressively! But worries that high inflation and an economic slowdown could cause a recession are outweighing any BOE rate hike expectations.
Everything you need to know about the Bank of England
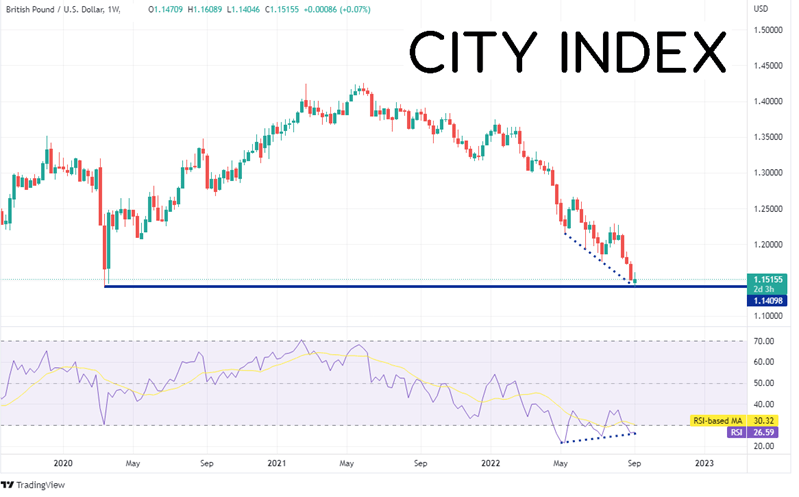
On a weekly timeframe, one can see that GBP/USD traded to its lowest level since March 2020, falling to 1.1405. The March 2020 low was 1.1411. The last time the pair traded below this level was 1985 when GBP/USD reached a low of 1.0520! However, notice how the RSI has made three higher lows as price has made three lower lows. This is often a signal that a reversal could take place.
Source: Tradingview, Stone X
Trade GBP/USD now: Login or Open a new account!
• Open an account in the UK
• Open an account in Australia
• Open an account in Singapore
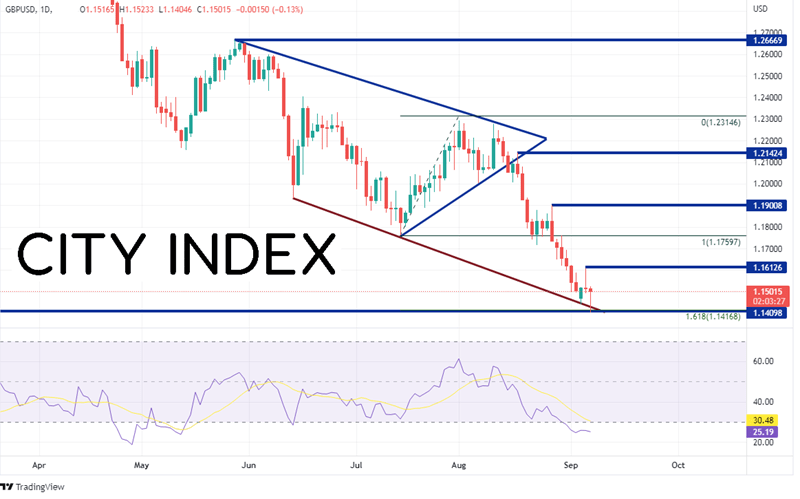
On a 240-minute timeframe, GBP/USD has been moving aggressively lower since price broke 1.3000 on April 22nd. During the first half of the summer, the pair had been moving sideways in a symmetrical triangle. As price neared the apex on August 15th, it broke lower and paused at the low of the triangle near 1.1760. However, by August 26th, price had continued to move lower. Today, GBP/USD pierced a confluence of support at a downward sloping trendline, horizontal support, and the 161.8% Fibonacci extension from the lows of July 14th to the highs of August 1st between 1.1410 and 1.1417. Today’s price action also formed a hammer candlestick, which indicates price may be ready for a move higher.
Source: Tradingview, Stone X
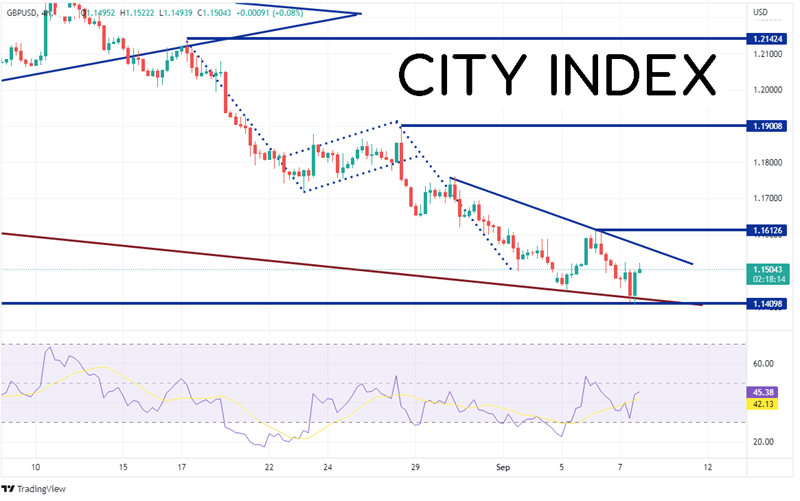
On a 240-minute timeframe, GBP/USD had recently reached its target for a flag formation, however, price is still making a series of lower highs. First resistance is at a downward sloping trendline near 1.1570. However, price will need to trade above the September 6th highs at 1.1612 to convince traders that some kind of reversal is taking place. Then next resistance is the highs from August 26th at 1.1901. However, if resistance holds and price moves lower, the first level of support is today’s low at 1.1405. Below there, its wide open until the lows of 1985 at 1.0520!
Source: Tradingview, Stone X
GBP/USD reached its lowest level since 1985 today at 1.1405. Will it continue to trade lower? There are some signs that the pair could be ready to bounce, such as the RSI divergence in oversold territory, the hammer candlestick, and the confluence of support at the lows. In addition, with a potential rate hike by the BOE next week, there may be some profit taking before then.
Learn more about forex trading opportunities.
Latest market news
Yesterday 01:23 PM
Yesterday 06:01 AM
April 18, 2024 11:27 PM
April 18, 2024 04:46 PM
Latest Forex articles
Yesterday 06:01 AM
April 17, 2024 02:40 PM
April 17, 2024 04:47 AM