


Asian Indices:
- Australia's ASX 200 index rose by 58.4 points (0.8%) and currently trades at 7,382.10
- Japan's Nikkei 225 index has risen by 686.15 points (2.37%) and currently trades at 29,578.84
- Hong Kong's Hang Seng index has fallen by -278.37 points (-1.1%) and currently trades at 25,098.87
- China's A50 Index has fallen by -103.37 points (-0.65%) and currently trades at 15,778.68
UK and Europe:
- UK's FTSE 100 futures are currently up 16 points (0.22%), the cash market is currently estimated to open at 7,253.57
- Euro STOXX 50 futures are currently up 23.5 points (0.55%), the cash market is currently estimated to open at 4,274.06
- Germany's DAX futures are currently up 71 points (0.45%), the cash market is currently estimated to open at 15,759.77
US Futures:
- DJI futures are currently up 89.06 points (0.25%)
- S&P 500 futures are currently up 37.5 points (0.24%)
- Nasdaq 100 futures are currently up 8.5 points (0.18%)
Indices:
Japan’s Nikkei 225 gapped higher after PM Kishida retained power during the weekend’s election. Asian indices were also broadly higher on upbeat export data from Korea and China. Korean export growth rose 24% y/y in October, up from 16.7% in September but missing estimates of around 27%. It is the eight consecutive month of double-digit growth for their exports. Pent up demand for Korean chips and petrochemical products have been the main driver.
China’s manufacturing PMI expanded slightly at 50.6 from 50 previously, according to the Caixin report. Whilst output is expanding at its fastest rate in 4-months and seemingly troughed in August, power shortages and rising costs have weighed on production. Yet this is a rosier number than the one seen by China’s official NBS read over the weekend, which saw the sector contract at 49.2.
The bull flag breakout on the FTSE 100 has failed, as prices pulled back to the flag instead of moving higher in line with our bias. However, prices did hold above the 7181 low and formed a large bullish hammer on Friday which shows there is demand above 7180. Furthermore, Friday’s candle was seen on above-average volume to further suggest a swing low may have been seen. Despite the setback from the bull flag, an inverted head and shoulder pattern still appears to be paying out on the daily chart with a projected target sitting around 7350.
FTSE 350: Market Internals
FTSE 350: 4147.54 (-0.16%) 29 November 2021
- 114 (32.48%) stocks advanced and 221 (62.96%) declined
- 13 stocks rose to a new 52-week high, 8 fell to new lows
- 58.97% of stocks closed above their 200-day average
- 42.17% of stocks closed above their 50-day average
- 23.36% of stocks closed above their 20-day average
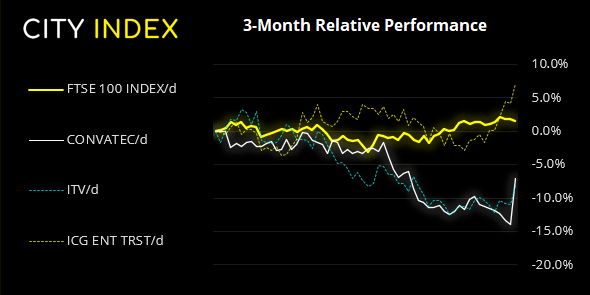
Outperformers:
- + 8.03%-ConvaTec Group PLC(CTEC.L)
- + 3.26%-ITV PLC(ITV.L)
- + 2.97%-ICG Enterprise Trust PLC(ICGT.L)
Underperformers:
- -7.70%-Games Workshop Group PLC(GAW.L)
- -4.45%-Natwest Group PLC(NWG.L)
- -4.27%-CLS Holdings PLC(CLSH.L)
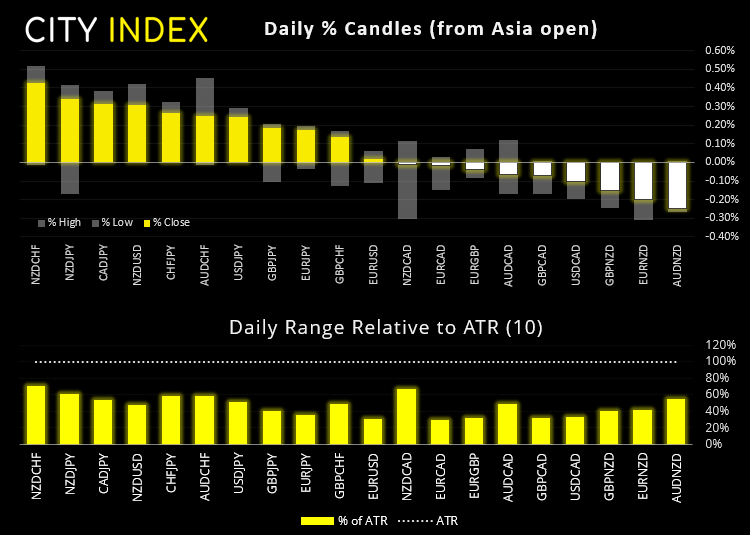
Forex:
Today’s main economic event is at 15:00 when the ISM manufacturing PMI report is in focus for traders. The supplier deliveries component will be one to watch as it is a proxy for supply chain bottlenecks. It rose to 73.4% in September as supply disruptions remain a hot topic, and if sustained will stymie the economic recovery and likely provide more inflation pressures. Prices paid were also relatively high at 81.2 (although down from the 92.1 peak) and the longer they remain at such high levels the further pressure it will place on inflation down the track.
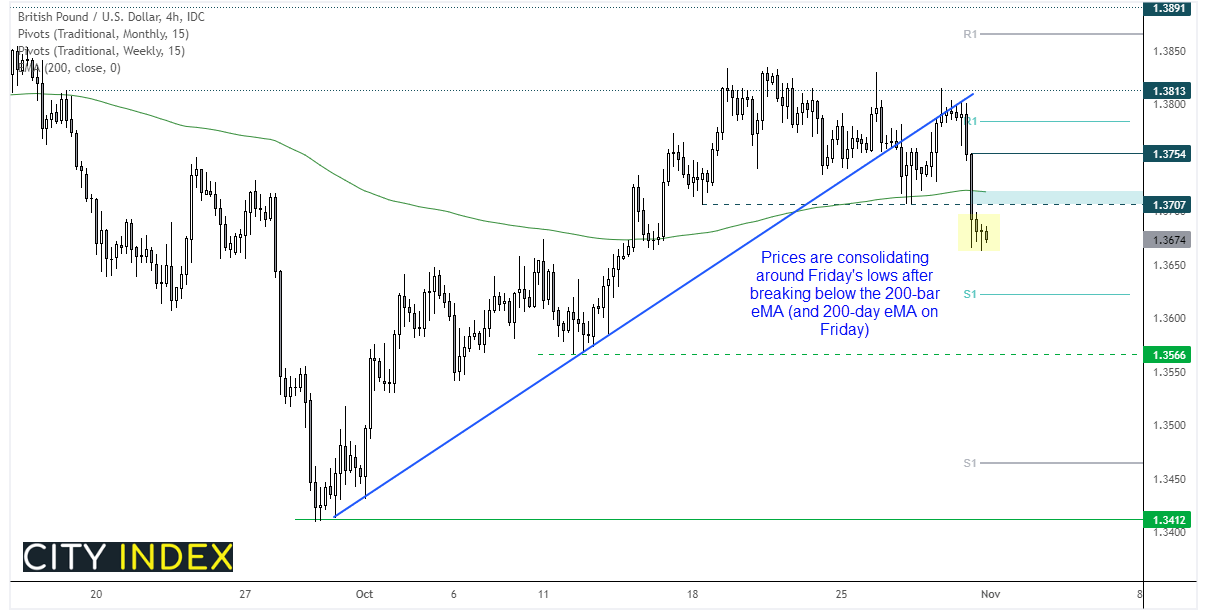
Volatility was suppressed overnight, despite mixed data coming out China over the past 48 hours. However, GBP/USD could be one to watch after it closed beneath its 200-day eMA on Friday with a bearish engulfing candle. Assuming the market has topped out is it interesting to note that it has occurred around 30 days since its prior peak (and the prior peak to leak was 33 days).
Due to Friday’s candle we are either looking for bearish setups within Friday’s range, or wait for a break of Friday’s low to assume bearish continuation. We can see on the four-hour chart that bearish momentum took hold after prices respected a broken trendline as resistance. The 200-bar eMA sits around October 27th lows, so any minor pullbacks to that area could be of interest to bears.
Commodities:
Oil prices were slightly lower overnight as China released gasoline and diesel reserves. WTI is currently down around -0.4% brent is down -0.9%. With FOMC and OPEC+ meetings over Wednesday and Thursday we may find oil prices in a holding pattern leading into these events.
Copper futures continue to edge lower as part of a countertrend move, yet momentum is waning as it tries to form a base above the broken trendline on the daily chart. It currently trades at 4.385 around its 50-day eMA and above its 200-day eMA.
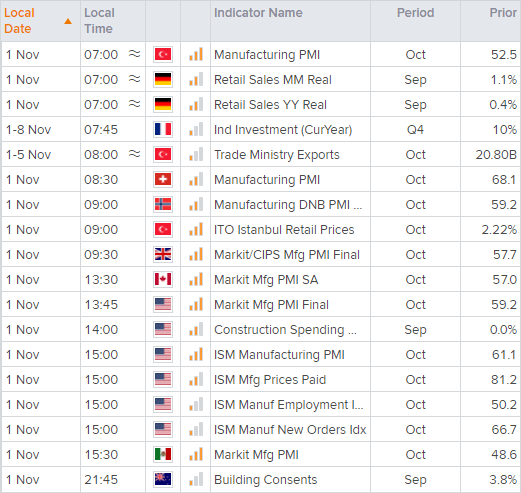
Up Next (Times in GMT)
How to trade with City Index
You can trade easily trade with City Index by using these four easy steps:
-
Open an account, or log in if you’re already a customer
• Open an account in the UK
• Open an account in Australia
• Open an account in Singapore
- Search for the company you want to trade in our award-winning platform
- Choose your position and size, and your stop and limit levels
- Place the trade
Latest market news
Today 08:33 AM
Latest Forex articles
Yesterday 04:47 AM
April 16, 2024 12:00 PM
April 16, 2024 04:24 AM