


Asian Indices:
- Australia's ASX 200 index rose by 42.6 points (0.61%) and currently trades at 7,001.50
- Japan's Nikkei 225 index has fallen by -146.83 points (-0.53%) and currently trades at 27,725.13
- Hong Kong's Hang Seng index has fallen by -251.85 points (-1.52%) and currently trades at 16,305.46
- China's A50 Index has fallen by -126.52 points (-1.05%) and currently trades at 11,918.52
UK and Europe:
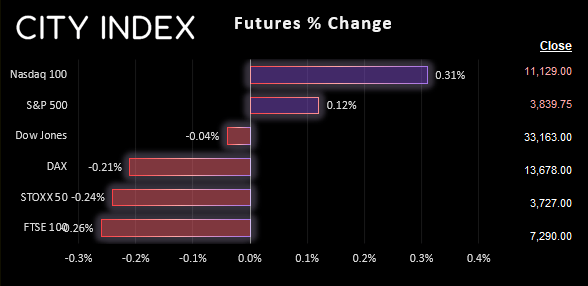
- UK's FTSE 100 futures are currently down -18.5 points (-0.25%), the cash market is currently estimated to open at 7,287.64
- Euro STOXX 50 futures are currently down -7 points (-0.19%), the cash market is currently estimated to open at 3,732.28
- Germany's DAX futures are currently down -21 points (-0.15%), the cash market is currently estimated to open at 13,667.75
US Futures:
- DJI futures are currently down -22 points (-0.07%)
- S&P 500 futures are currently up 29.5 points (0.27%)
- Nasdaq 100 futures are currently up 2.75 points (0.07%)
Trading ranges were relatively tight overnight, considering the mid-term results were being released. I do not remember that being the case in 2018, when Democrats took the seats back from Republicans with Trump at the helm. However, the final results are yet to arrive and it could still prompt some volatility, depending on which way they swing.
The US dollar is likely to come under further pressure if Republicans win the house and the Senate, as traders assume it will make it harder (if not impossible) for the Biden administration to roll out yet more inflationary packages. If the Republicans take the House but Dems retain the Senate, I suspect it could even see the US dollar strengthen as they will get the last say in any bills voted in ‘da house’. But we also need to factor in that markets have begun pricing in a Republican victory, and those bets could come unwound it’s not the case. And with that, we’ll take a look at the euro.
The dynamics behind the euro have been changing in recent times, with large speculators increasingly net-long euro futures and traders (on aggregate) culling a significant proportion of net-long exposure to the US dollar. 1-month and 1-week put demand for the euro (downside protection) hit lows in late September and have reduce by at least a half as investors became less concerned with the euro’s demise. Yet EUR/USD has only managed to rise around 5% since the September low, which is a drop in the ocean compared with its established downtrend. Put together, a case could be built that the euro has further to rise and the dollar has further to fall.
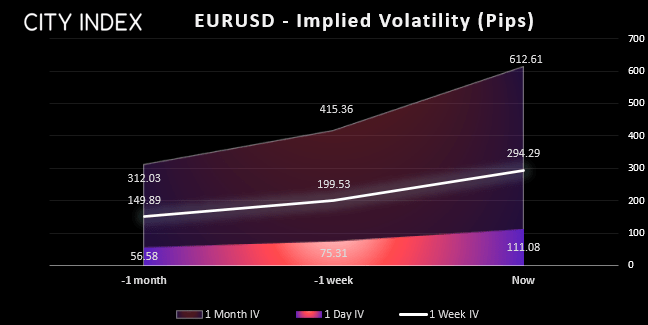
But over the near-term things could be different. Overnight implied volatility for EUR/USD has risen to its highest level since July, with options markets suggesting a ~110 pip move in either direction (or ~300 pip move in either direction over the next week). So let the results roll in, and take nothing for granted.
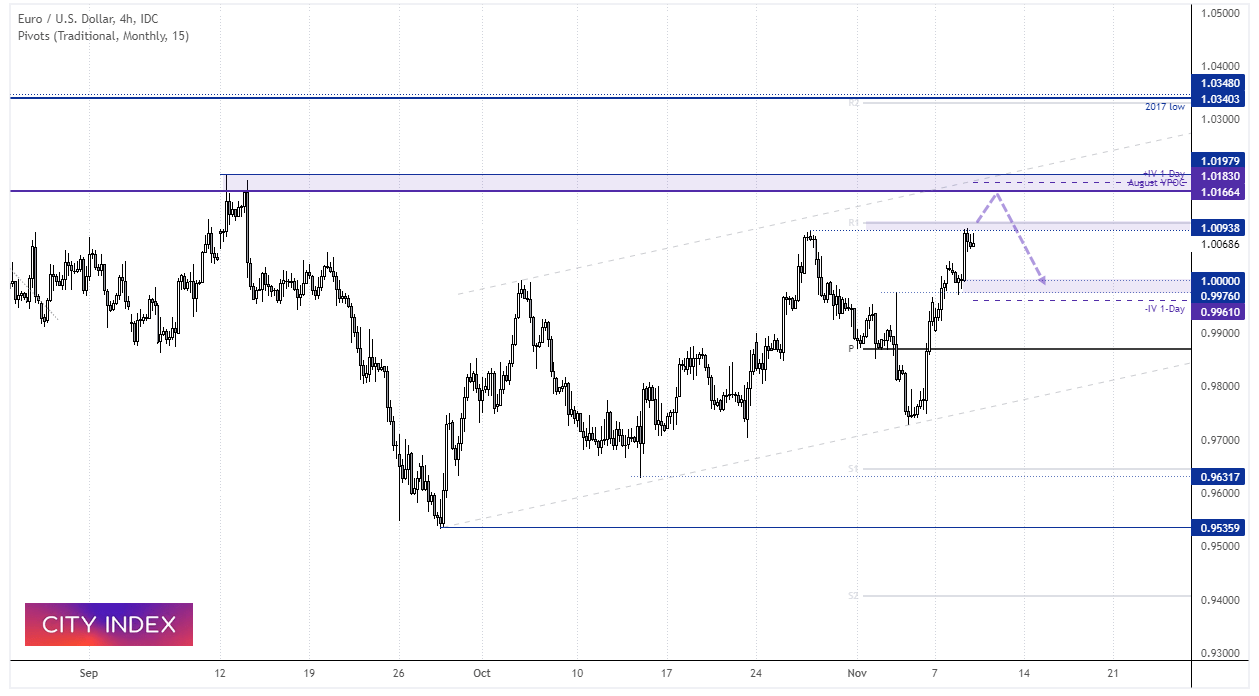
EUR/USD 4-hour chart
EUR/USD is trading within a rising channel on the 4-hour chart and has already achieved a decent rally from the channel’s low ahead of the mid-terms in anticipation of a Republican win. The rally has stalled around the monthly R1 pivot point and prior cycle high, but also sows the potential to push higher once more.
However, take note of a cluster of resistance around 1.0170 which includes the September 13th high, upper implied volatility range and the August VPOC (the most amount of trades took place in August in this area – which can act like a magnet and provide resistance).
And with the US dollar index holding above a key trendline, I’m on guard for a minor new high on EUR/USD before a prominent swing high and move lower. In which case, parity makes a potential area for bears to focus on.
FTSE 350 – Market Internals:
FTSE 350: 4040.16 (0.66%) 08 November 2022
- 229 (65.43%) stocks advanced and 112 (32.00%) declined
- 1 stocks rose to a new 52-week high, 2 fell to new lows
- 12.57% of stocks closed above their 200-day average
- 50.57% of stocks closed above their 50-day average
- 5.43% of stocks closed above their 20-day average
Outperformers:
- + 8.29% - Ferrexpo PLC (FXPO.L)
- + 7.36% - Elementis PLC (ELM.L)
- + 6.86% - Wizz Air Holdings PLC (WIZZ.L)
Underperformers:
- -15.14% - Hilton Food Group PLC (HFG.L)
- -8.23% - DCC PLC (DCC.L)
- -5.22% - Persimmon PLC (PSN.L)
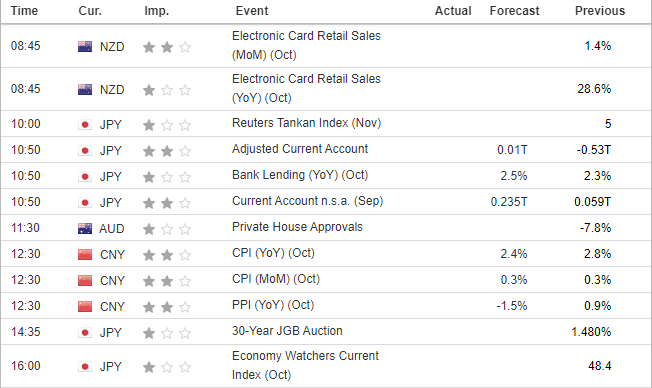
Economic events up next (Times in GMT)
How to trade with City Index
You can easily trade with City Index by using these four easy steps:
-
Open an account, or log in if you’re already a customer
• Open an account in the UK
• Open an account in Australia
• Open an account in Singapore
- Search for the company you want to trade in our award-winning platform
- Choose your position and size, and your stop and limit levels
- Place the trade
Latest market news
Yesterday 10:40 PM
Yesterday 04:00 PM
Latest Trade Ideas articles


Yesterday 10:40 PM