


Asian Indices:
- Australia's ASX 200 index fell by -14.9 points (-0.2%) and currently trades at 7,499.60
- Japan's Nikkei 225 index has fallen by -73.14 points (-0.26%) and currently trades at 27,956.05
- Hong Kong's Hang Seng index has fallen by -213.1 points (-0.96%) and currently trades at 22,018.93
- China's A50 Index has fallen by -68.38 points (-0.5%) and currently trades at 13,734.95
UK and Europe:
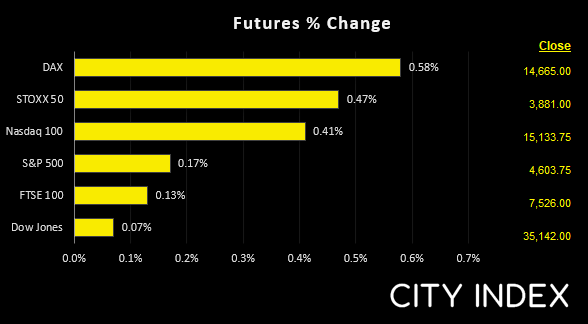
- UK's FTSE 100 futures are currently up 7.5 points (0.1%), the cash market is currently estimated to open at 7,586.25
- Euro STOXX 50 futures are currently up 17 points (0.44%), the cash market is currently estimated to open at 3,976.14
- Germany's DAX futures are currently up 85 points (0.58%), the cash market is currently estimated to open at 14,691.05
US Futures:
- DJI futures are currently up 17 points (0.05%)
- S&P 500 futures are currently up 61.5 points (0.41%)
- Nasdaq 100 futures are currently up 6.75 points (0.15%)
Manufacturing data fell to 49.5 to denote industry contraction for China, whilst services fell to 48.4 which is its fastest rate of contraction in seven months. This has then seen the composite read (manufacturing and service combined) fall to 48.8, which its lowest level since March 2020. The Hang Seng was the weakest performer and fell -0.8%, and the China A50 is off by -0.4%. Commodity currencies are all lower (led by AUD) although JPY is the weakest and USD is the strongest.
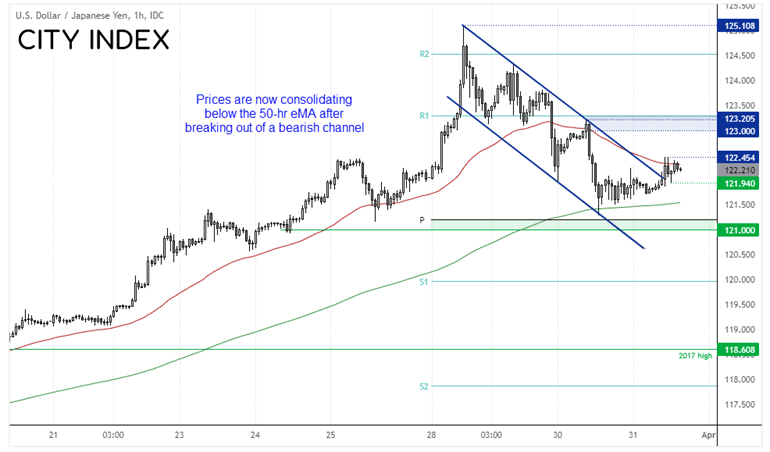
USD/JPY breaks out of its bearish channel
USD/JPY managed to hold above its 200-hr eMA, although its choppy price action was underwhelming for our bullish bias. That said, we have since seen the hourly chart close above trend resistance to confirm a channel breakout, and prices are now holding above 122. If we see a break above 122.45 then our next target is 123 whilst prices remain above the consolidation lows around 121.94.
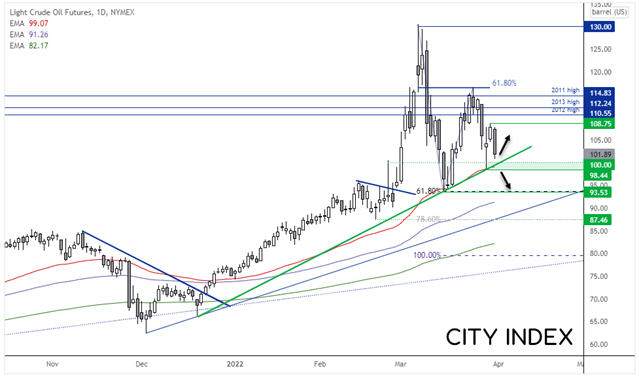
WTI heads for $100
Oil prices were lower overnight after the Biden administration said they are considering releasing a large amount of oil to help stimmy inflation. Light crude is down around -5.3% and brent is off by -4.5%. WTI prices are coiling up on the daily chart, with prices continuing to respect trend support from the December 20th low, yet two low highs have formed after its epic fall from $130.
This brings into question whether bulls will be tempted to reload should prices dip to $100, around the 50-day eMA. A break above the 108.75 high would see it break out of its coiling formation, whereas a break beneath the 98.44 low also invalidates trend support and brings 93.53 into focus, along with trend support from the December low. Interestingly, the 61.8% and 78.6% Fibonacci expansions sits right on the March and February lows, whilst the 100% projection sits around $80.
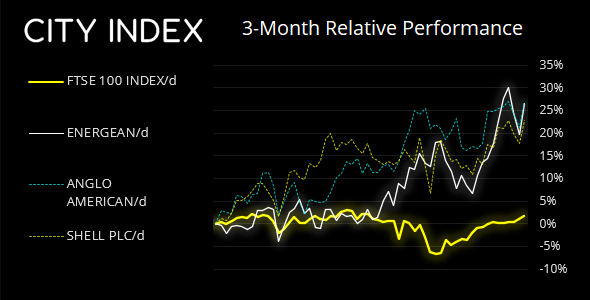
FTSE 350: Market Internals
FTSE 350: 4250.68 (0.55%) 30 March 2022
- 96 (27.35%) stocks advanced and 251 (71.51%) declined
- 9 stocks rose to a new 52-week high, 1 fell to new lows
- 37.61% of stocks closed above their 200-day average
- 54.13% of stocks closed above their 50-day average
- 19.37% of stocks closed above their 20-day average
Outperformers:
- + 5.61% - Energean PLC (ENOG.L)
- + 4.60% - Anglo American PLC (AAL.L)
- + 4.43% - Shell PLC (SHEL.L)
Underperformers:
- -7.56% - Trainline PLC (TRNT.L)
- -7.24% - Vesuvius PLC (VSVS.L)
- -7.13% - Currys PLC (CURY.L)
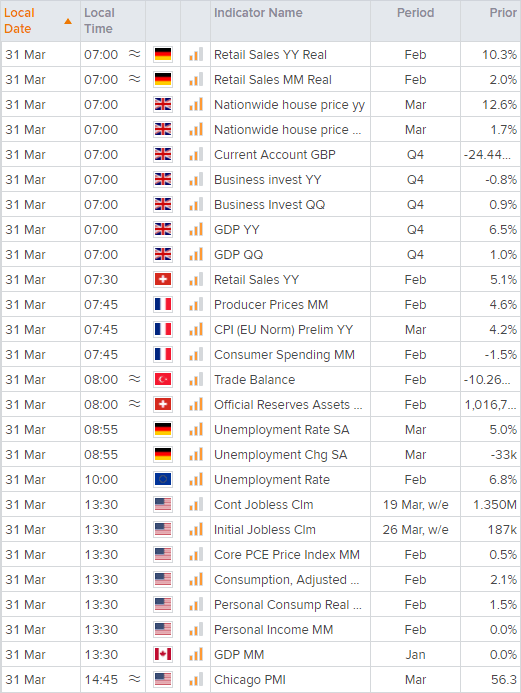
Up Next (Times in GMT)
How to trade with City Index
You can easily trade with City Index by using these four easy steps:
-
Open an account, or log in if you’re already a customer
• Open an account in the UK
• Open an account in Australia
• Open an account in Singapore
- Search for the company you want to trade in our award-winning platform
- Choose your position and size, and your stop and limit levels
- Place the trade
How to trade with City Index
You can easily trade with City Index by using these four easy steps:
- Open an account, or log in if you’re already a customer
- Search for the company you want to trade in our award-winning platform
- Choose your position and size, and your stop and limit levels
- Place the trade
Latest market news
Latest Forex articles

April 17, 2024 02:40 PM
April 17, 2024 04:47 AM
April 16, 2024 12:00 PM