


Asian Indices:
- Australia's ASX 200 index fell by -2.8 points (-0.04%) and currently trades at 7,491.00
- Japan's Nikkei 225 index has fallen by -38.86 points (-0.14%) and currently trades at 27,343.70
- Hong Kong's Hang Seng index has fallen by -368.21 points (-1.62%) and currently trades at 22,320.69
- China's A50 Index has risen by 193.36 points (1.39%) and currently trades at 14,151.76
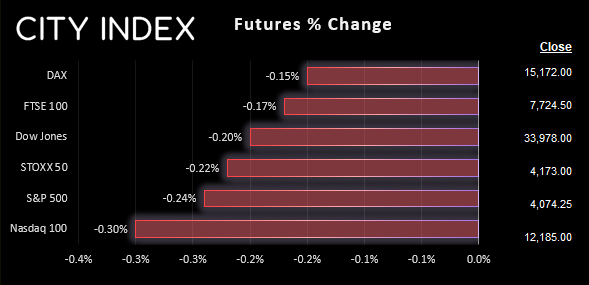
UK and Europe:
- UK's FTSE 100 futures are currently down -13.5 points (-0.17%), the cash market is currently estimated to open at 7,751.65
- Euro STOXX 50 futures are currently down -9 points (-0.22%), the cash market is currently estimated to open at 4,169.01
- Germany's DAX futures are currently down -23 points (-0.15%), the cash market is currently estimated to open at 15,127.03
US Futures:
- DJI futures are currently down -70 points (-0.21%)
- S&P 500 futures are currently down -39.5 points (-0.32%)
- Nasdaq 100 futures are currently down -10.5 points (-0.26%)
- A top Republican official said over the weekend that the risk of a conflict between the US and China over Taiwan were “very high”, after a US general sparked concerns with a memo stating the US could fight China within two years
- It was a quiet economic calendar during the Asian session, which resulted in small ranges for currencies
- China’s markets reopened after a week off to celebrate the lunar new year, and the CSI 300 came close to entering a bull market having risen nearly 20% from its October low
- The FTSE 100 is holding above the 2019 and 2020 highs and monthly R2 pivot point, and price action suggests its decline from the January high – so we’re on the lookout for another leg higher
- The DAX was supported by better than expected PMI reports last week, and as the OBV (on balance volume) has broken to a new cycle high it suggests the trend remains supported by bullish volume overall
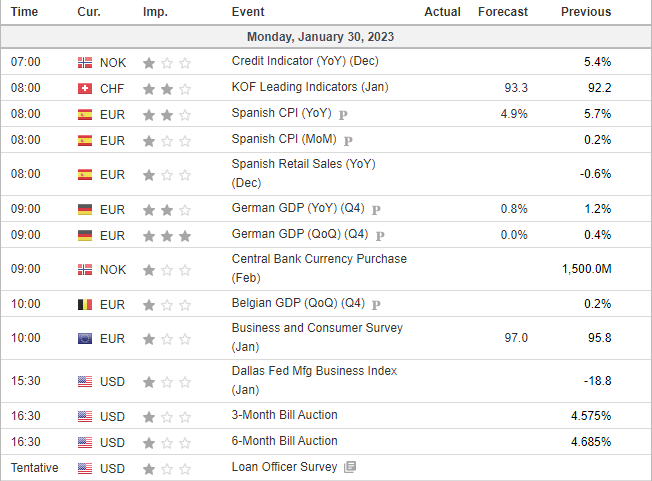
- A host of CPI and GDP reports are released across Europe, which could further support sentiment for indices should inflation soften
- Reports of a drone attack in Iran initially saw oil prices gap higher, and index futures are trading lower ahead of the open which points to a weak open for cash indices
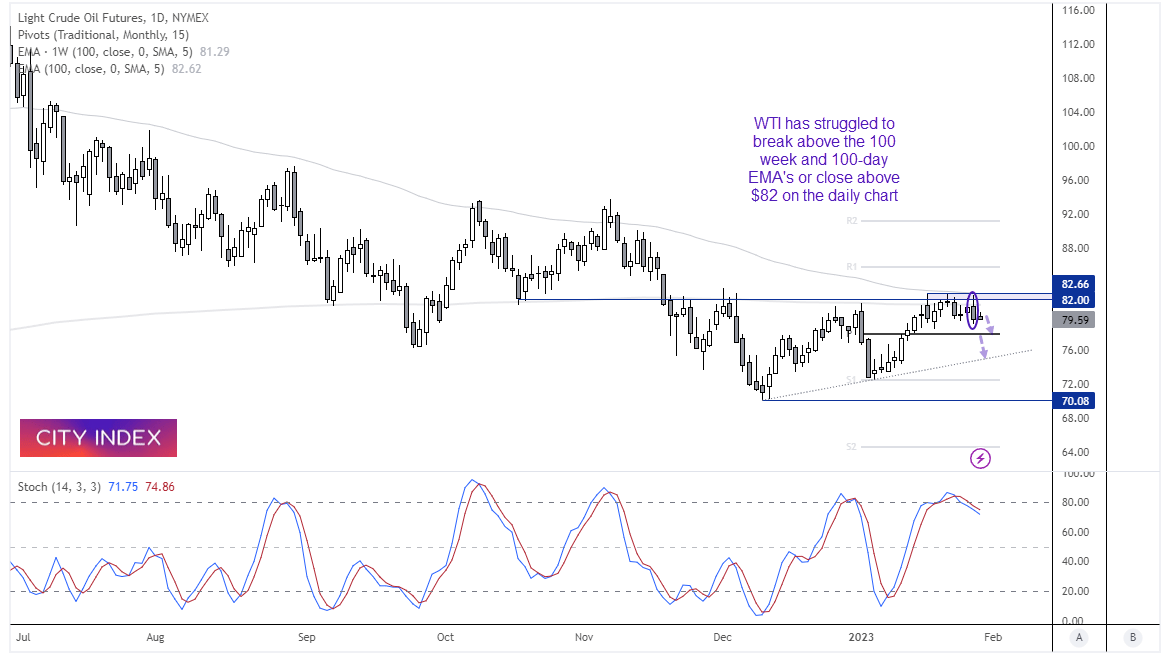
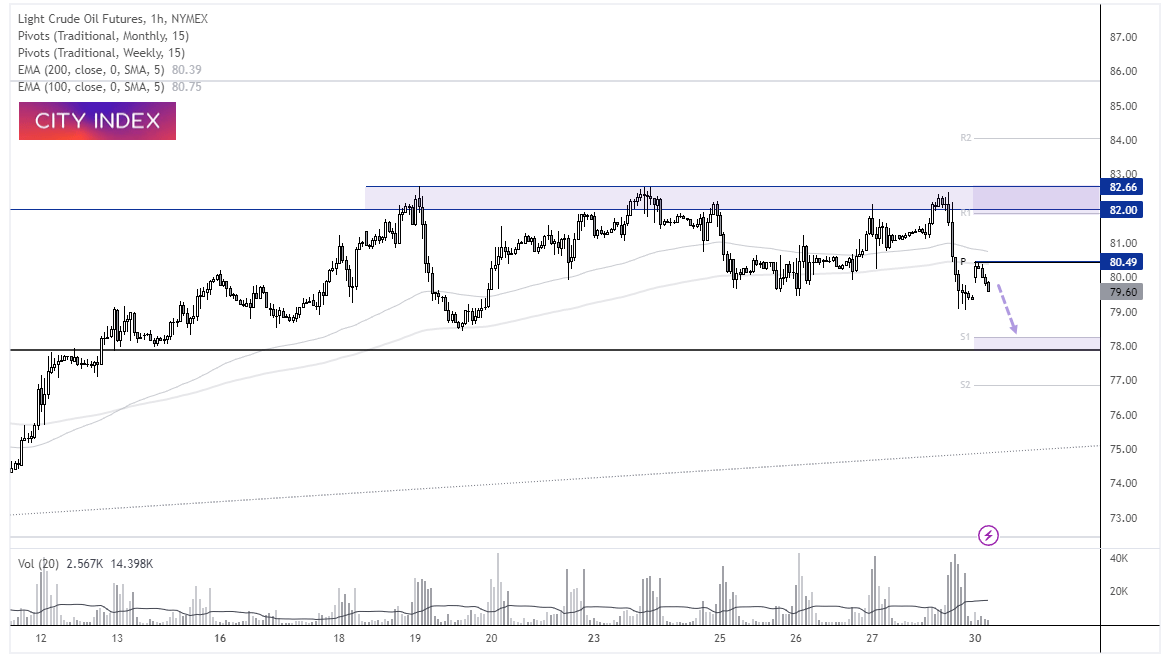
WTI crude futures charts:
WTI crude erased of its prior week’s gains last week after bulls once against struggled to hold the market above the 100-week and 100-day EMA. We can see on the daily chart that a bearish engulfing candle formed on Friday, prior to which several upper wicks have formed on the candles which failed to see a daily close above $82 – a level that has acted as both support and resistance since October. Furthermore, the stochastic oscillator has generated a sell signal after rising into the overbought zone and then turned lower.
The bias remains bearish below last week’s high of $82.66 ad for an initial move down to the monthly pivot point at 77.85. Bears could seek bearish setups on intraday timeframes to increase the potential reward to risk. At the time of writing WTI is close to fully closing its weekend gap higher, where a move below $79 assumes $80.49 to be a key intraday swing high.
Economic events up next (Times in GMT)
Latest market news
Yesterday 11:48 PM
Yesterday 11:16 PM
Yesterday 05:00 PM
Yesterday 01:13 PM
Latest Trade Ideas articles

Yesterday 11:48 PM
Yesterday 11:16 PM
Yesterday 05:00 PM