


EUR/USD takeaways
- A run of weak economic data suggests that Eurozone growth is faltering in Q2, highlighted by today’s soft German factory orders report.
- EUR/USD tried to bounce off its 200-day EMA last week but that move has already been reversed in this week’s trade.
- A break below 1.0640 support could expose the year-to-date lows in the low-1.0500s next.
Euro fundamental analysis
When it comes to economic performance, it’s all about expectations.
Heading into the winter, traders and economists were terrified of an “energy crunch” in the Eurozone leading to a deep recession. Instead, the warmer-than-feared winter allowed mainland Europe to squeak by with mediocre-but-better-than-expected 0.1% growth through the first quarter of this year (though that figure will be revised later this week).
Now though, after the better-than-anticipated growth early in Q1, the signs are piling up that the Eurozone economy is sputtering in Q2. Earlier today, traders learned that German factory orders fell -0.4% in April, defying expectations for a 2.8% rise after March’s -10.7% drop.
Germany accounts for nearly a third of the entire Eurozone’s GDP, and if its key manufacturing sector continues to contract, it will be difficult for the continent to sidestep a recession, especially with the ECB continuing to hike interest rates through the summer.
Euro technical analysis – EUR/USD daily chart
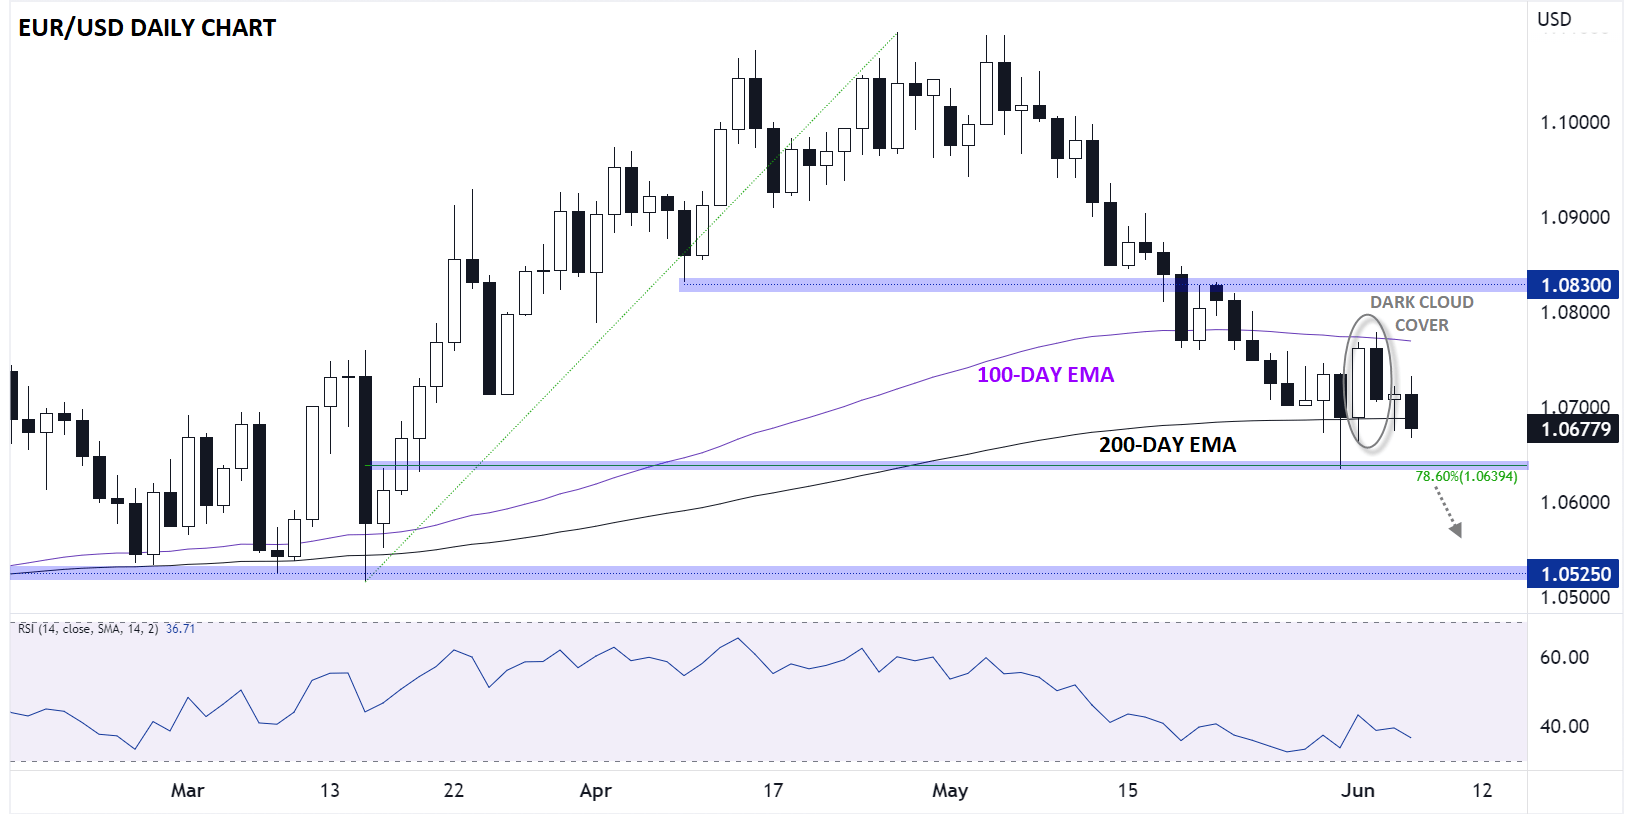
Source: TradingView, StoneX
As the chart above shows, the world’s most widely traded currency pair tried to bounce off its 200-day EMA near 1.0700 last week, but that move has already reversed. For fans of candlestick patterns, Friday’s price action created a clear “dark cloud cover” pattern, signaling a shift from buying to selling pressure and marking a near-term top for the pair; today’s price action shows potential for a similar pattern, if not an even more bearish “engulfing candle” formation.
With EUR/USD now on track to close below its 200-day EMA for the first time since last November, the last near-term support level to watch comes in at 1.0640, at the confluence of last week’s low and the 78.6% Fibonacci retracement of the pair’s March-April rally.
A break below 1.0640 would expose the year-to-date lows near 1.0500, whereas even a bounce off that support zone would likely be treated with skepticism unless and until the pair recaptures the 100-day EMA above 1.0775.
-- Written by Matt Weller, Global Head of Research
Follow Matt on Twitter: @MWellerFX
How to trade with City Index
You can trade with City Index by following these four easy steps:
-
Open an account, or log in if you’re already a customer
• Open an account in the UK
• Open an account in Australia
• Open an account in Singapore
- Search for the market you want to trade in our award-winning platform
- Choose your position and size, and your stop and limit levels
- Place the trade
Latest market news
Latest EUR/USD articles
April 17, 2024 04:47 AM
April 11, 2024 06:16 AM
April 8, 2024 03:35 AM
April 2, 2024 03:02 PM