


EUR/USD – Further potential push down sequence remains intact
click to enlarge chart
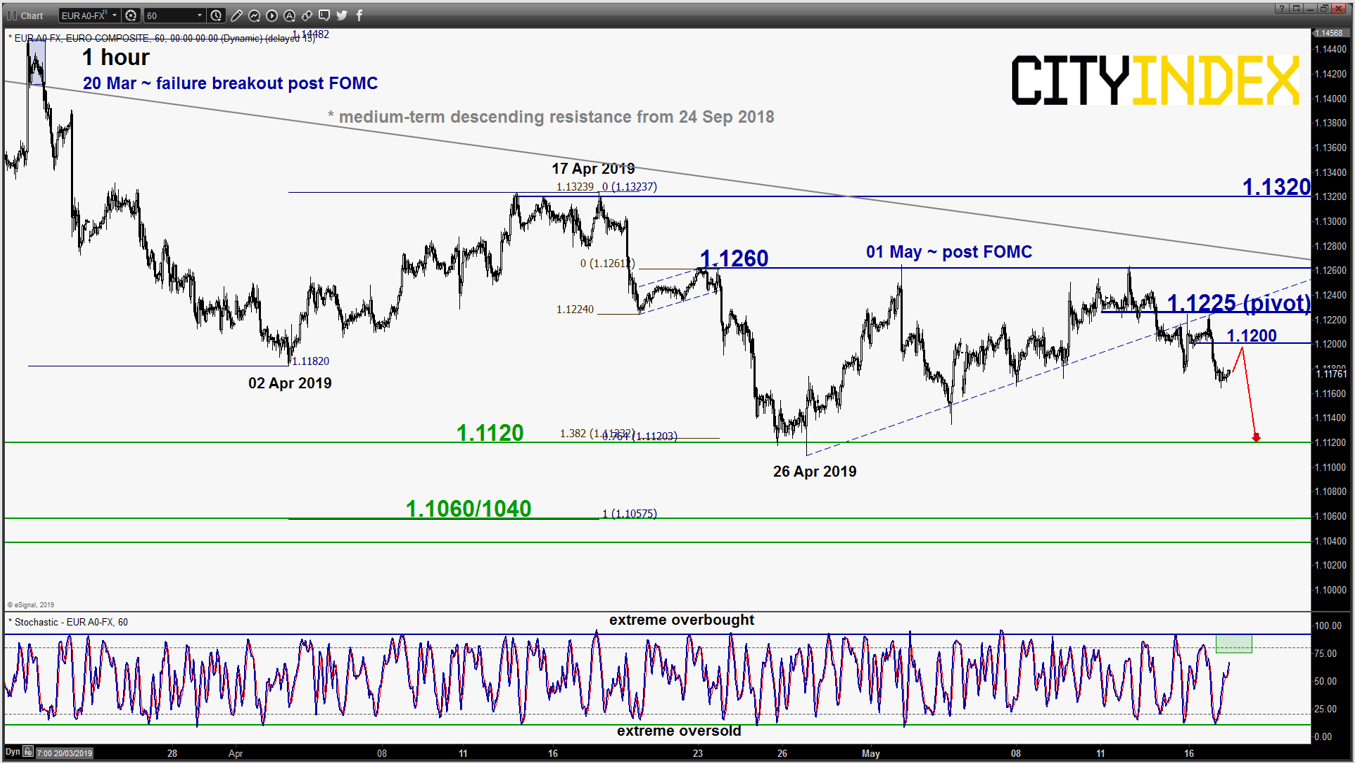
- Drifted down lower as expected (click here for a recap on our previous report) and printed a lower minor low of 1.1164 in yesterday’s U.S. session. The hourly Stochastic oscillator highlights the risk of a minor bounce at this juncture as it still has further room to manoeuvre to the upside before it reaches an extreme overbought level.
- Maintain bearish bias with a tightened key short-term pivotal resistance now at 1.1225 (also the pull-back resistance of the former ascending support from 26 Apr 2019 low) for a further potential push down to retest 1.1120 in the first step.
- However, a break with an hourly close above 1.1225 negates the bearish tone for a further corrective bounce towards 1.1260 (range resistance in place since the recent FOMC meeting held on 01 May).
GBP/USD – Risk of corrective bounce
click to enlarge chart
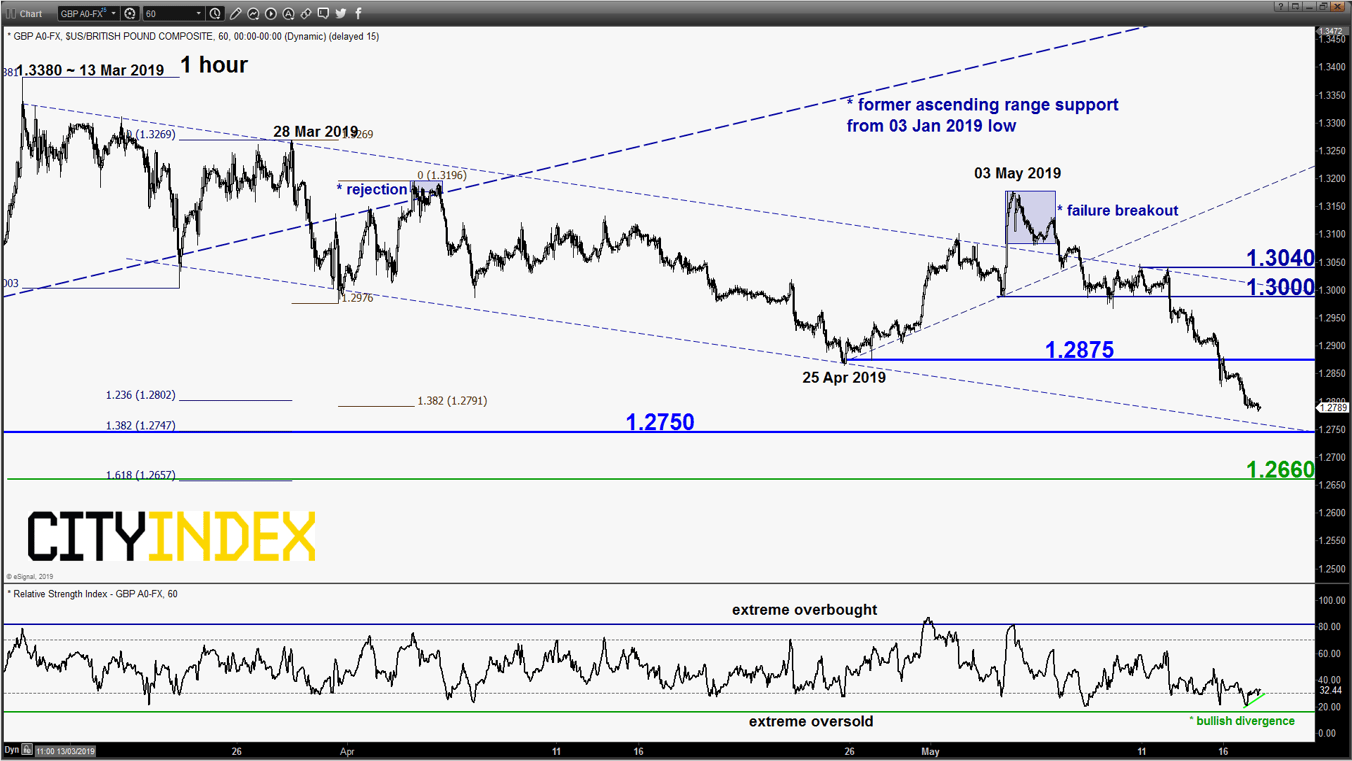
- Continued to inch down lower as expected as it printed a current intraday low of 1.2781 in today’s Asian session. It is now coming close to our target/support of 1.2750 as per highlighted in our previous report.
- Interestingly, the hourly RSI oscillator has traced out a bullish divergence signal at its oversold region which highlights the risk of a minor corrective bounce. Prefer to turn neutral now between 1.2875 and 1.2750. An hourly close above 1.2875 triggers a bounce towards 1.3000/1.3040.
- On the flipside, below 1.2750 sees a further slide towards the next near-term support at 1.2660 (1.618 Fibonacci expansion from 13 Mar 2019 high & 76.4% retracement of the previous multi-month up move from 03 Jan 2019 low to 13 Mar 2019 high).
USD/JPY – Recent bounce is losing momentum
click to enlarge chart
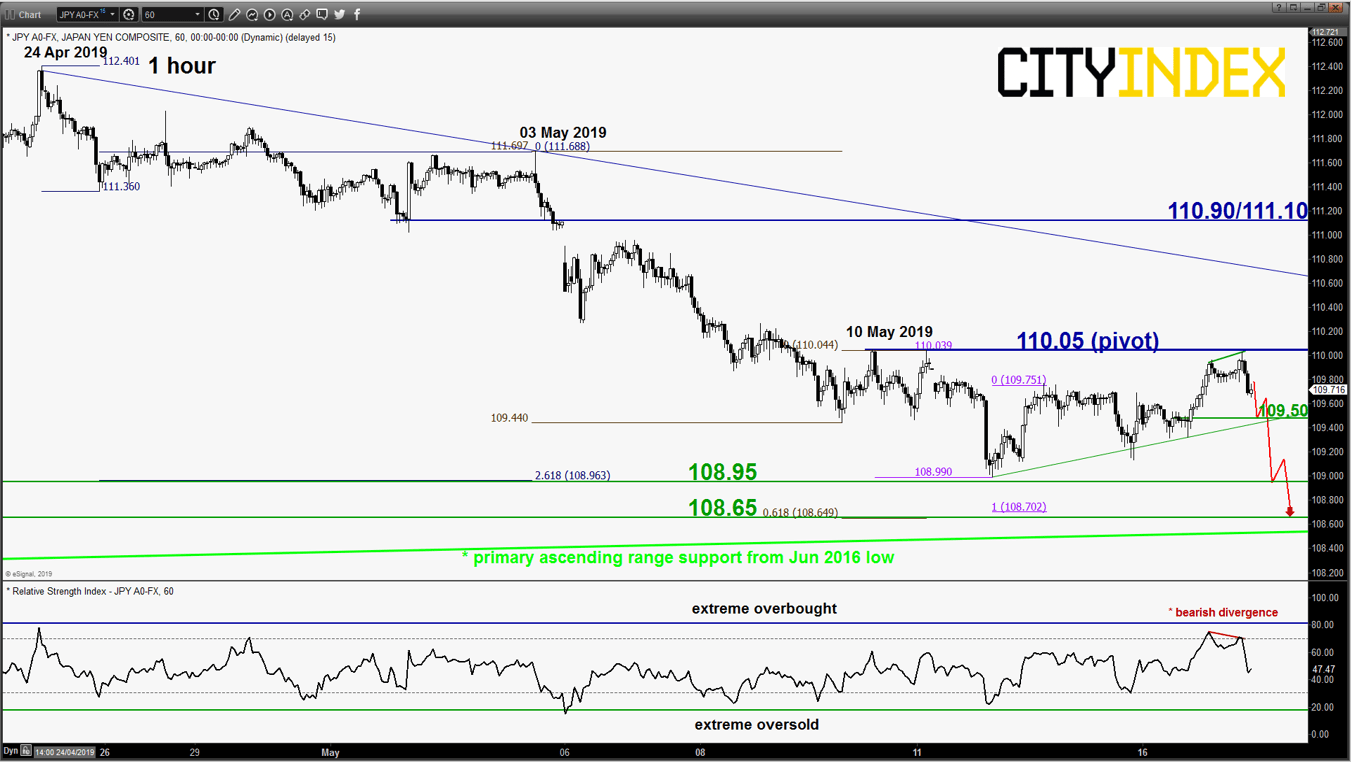
- The recent bounce in place since 13 May 2019 swing low area of 109.00 has appeared to be losing momentum below a short-term resistance at 110.05 (the minor swing high areas of 10/11 May 2019).The hourly RSI oscillator has traced out a bearish divergence signal at its overbought region.
- Thus, we can consider yesterday’s push up above 109.75 as a whipsaw/noise. Maintain bearish bias with 110.05 as the key short-term pivotal resistance (also a Fibonacci retracement/expansion cluster) and a break below 109.50 opens up scope for another round of potential impulsive downleg to target 108.95 and the 108.65 major support (also the primary ascending range support from Jun 2016 low).
- However, a break with an hourly close above 110.05 invalidates the bearish scenario for a further corrective rebound sequence towards the key medium-term resistance zone of 110.90/111.10 (also the pull-back resistance of the former ascending support from 03 Jan 2019 low).
AUD/USD – Further drop remains in progress
click to enlarge chart
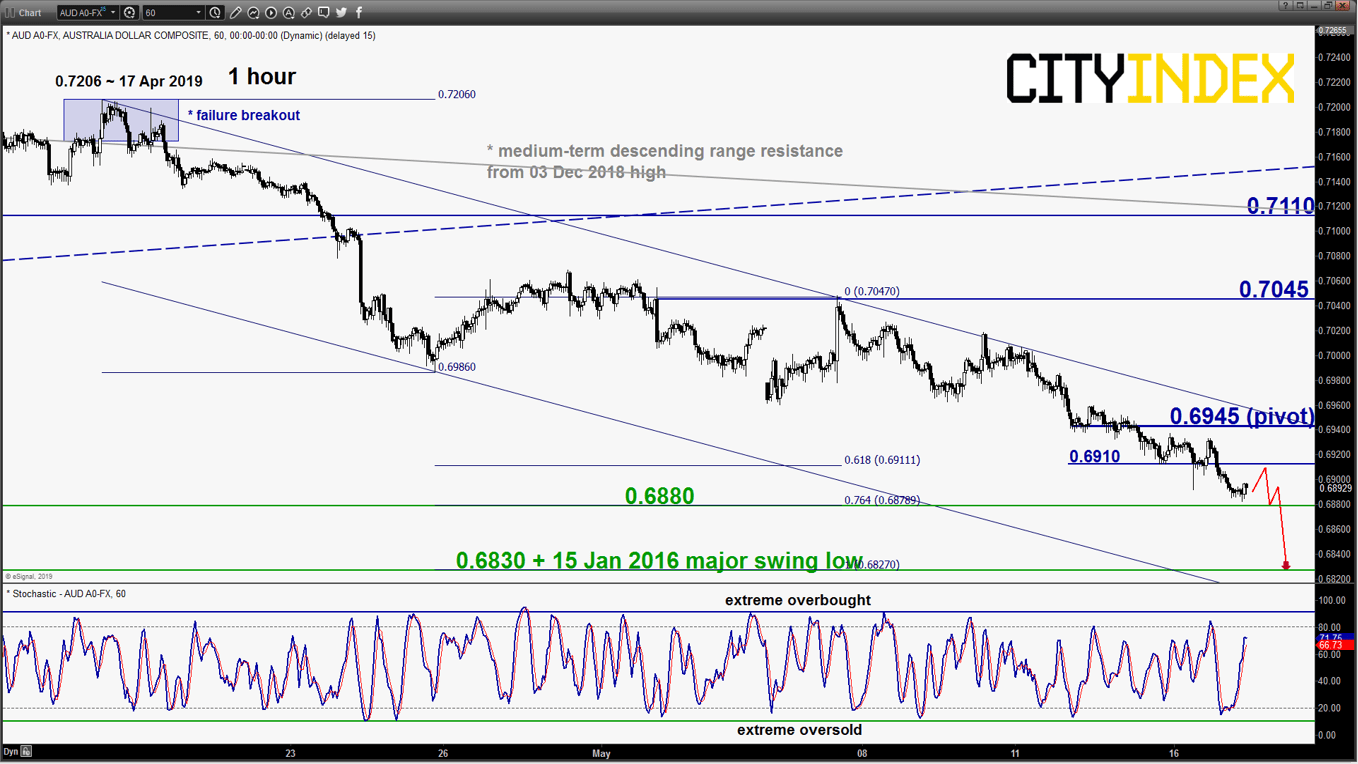
- Drifted down lower and almost hit first support/target of 0.6880 as per highlighted in our previous report. No clear signs of bearish exhaustion; maintain bearish bias with a tightened key short-term pivotal resistance now at 0.6945 for a further potential push down to target a significant support at 0.6830 before risk of a corrective rebound occurs.
- However, a break with an hourly close above 0.6945 invalidates the bearish scenario to kickstart the corrective rebound sequence towards the next intermediate resistance at 0.7045 (formed after the recent RBA meeting on 07 May)
Charts are from eSignal
Latest market news
Today 08:15 AM
Latest Forex articles

Yesterday 11:09 PM
Yesterday 04:00 PM