


May 27, 2022 4:12 PM
Considered to be the Fed’s favorite measure of inflation, the Core PCE for April was 4.9% YoY vs an expectation of 4.9% YoY and a reading of 5.2% YoY in March. This is the first drop in the index in 17 months. Although one reading isn’t considered a trend, looking at in context with other inflation readings, it may be suggesting that inflation has plateaued. The headline PCE reading was 6.3% YoY vs an expectation of 6.4% YoY and a March reading of 6.6% YoY. Recall that the April CPI reading was 8.3% YoY for April vs 8.5% YoY in March, while the Core CPI for April was 6.2% in April vs 6.5% in March. The softer inflation data has led to decreased expectations of aggressive Fed rate hikes and helped the US Dollar Index to sell off.
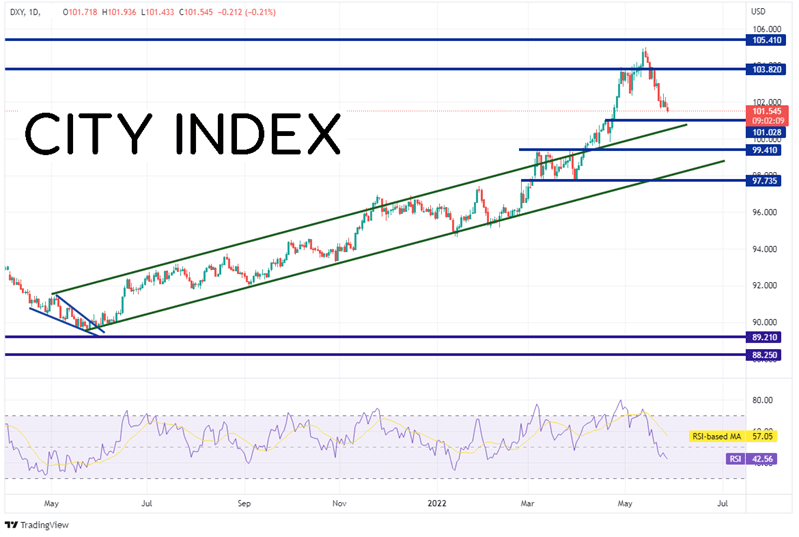
The US Dollar Index had been rallying in an upward sloping channel since May 2021. The DXY broke above the top of the channel on April 5th and continued moving higher, taking out the highs of January 2017 on May 6th and making its way to a recent high of 105.00 on May 8th. Since then, price has been pulling back and is nearing support on the daily timeframe at 101.03.
Source: Tradingview, Stone X
Trade the DXY now: Login or Open a new account!
• Open an account in the UK
• Open an account in Australia
• Open an account in Singapore
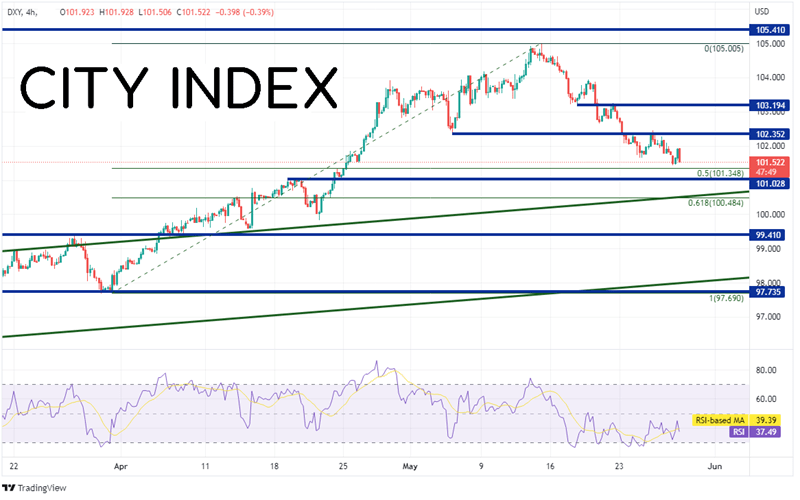
On a 240-minute timeframe, DXY has pulled back to the just above the 50% retracement level from the lows of March 31st to the highs of May 8th, near 101.34. Below there is horizontal support from the highs of April 19th at 101.03, then a confluence of support at the top, upward sloping trendline of the long-term channel and the 61.8% Fibonacci retracement level from the same timeframe near 100.50. First resistance is at the May 5th low near 102.35 and then again at the May 18th low of 103.19. Above there, price can move back up to the May 8th highs of 105.00.
Source: Tradingview, Stone X
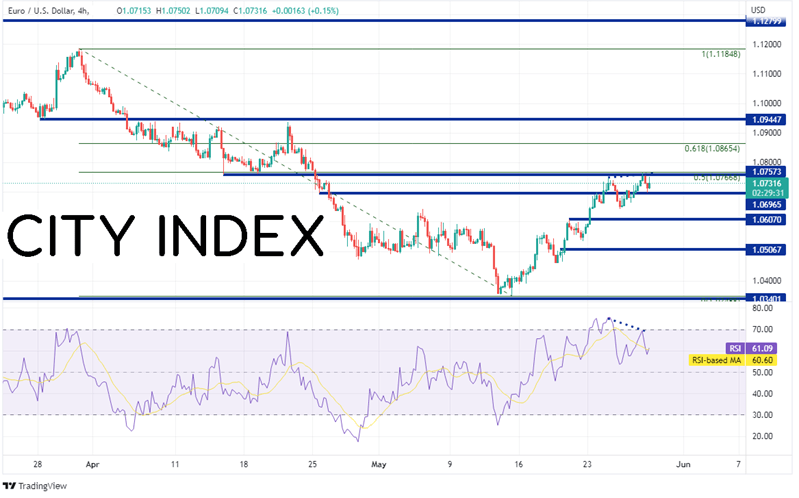
EUR/USD makes up 57% if the US Dollar Index. Therefore, it makes sense that the DXY and EUR/USD would move in opposite directions a majority of the time. EUR/USD made a near term low on May 13th at 1.0348, holding support from the 2017 lows at 1.0340. The pair then bounced to horizontal resistance and the 50% retracement level from the March 31st highs to the May 13th lows near 1.0757/1.0767. If price continues higher, the next level of resistance is at the 61.8% Fibonacci retracement level from the same timeframe near 1.0865. Above there, price can move to horizontal resistance at 1.0945 and then the highs of March 31st at 1.1185.
Source: Tradingview, Stone X
Trade EUR/USD now: Login or Open a new account!
• Open an account in the UK
• Open an account in Australia
• Open an account in Singapore
However, notice that EUR/USD is diverging with the RSI on the 240-minute timeframe, an indication that price may be ready for a pullback. First support is at the May 19th highs of 1.0607 and then horizontal support near 1.0507. Below there, EUR/USD can fall to the lows of May 13th near 1.0348.
The Core PCE Index, said to be one of the Fed’s favorite measures of inflation for April came in weaker than the reading in March. Does this mean that inflation is plateauing? Markets have been taking the view that the “softer than prior months” inflation readings are a sign that the Fed may slow its aggressive rate hikes come September. As a result, the DXY has dipped and EUR/USD has gone bid.
Learn more about forex trading opportunities.