Well, here we are, more than 2 years into the pandemic and Covid is still roiling financial markets. Concerns about demand have intensified after Beijing locked down parts of Chaoyang District as the virus spread there. This triggered panic as people had hoped that lockdowns would ease in Shanghai rather than more restrictions being imposed elsewhere. But now the prospects of the capital city being put into a full lockdown has unnerved investors worldwide. Not only does this imply weaker demand from China, but it could reignite supply chain woes, further exacerbating inflationary pressures.
The Chinese yuan has fallen for the fifth day in a row, this time by more than 1%, lifting the USD/CNH to its highest level since November 2020. The Aussie and other commodity dollars have followed suit. Chinese equities dropped more than 5% overnight, with European and US futures also feeling the pain. Crude oil, copper and other metals all fell on demand concerns.
So, while the rest of the world’s largest economy are tightening belts, it looks like China might have to loosen its policy in order to keep its economy ticking over at the target rate in the second quarter. A couple of months ago, China set an economic growth target for the year of around 5.5%. This was the lowest level in more than a quarter-century of economic planning. But in light of the recent lockdowns, it might struggle to even achieve that target.
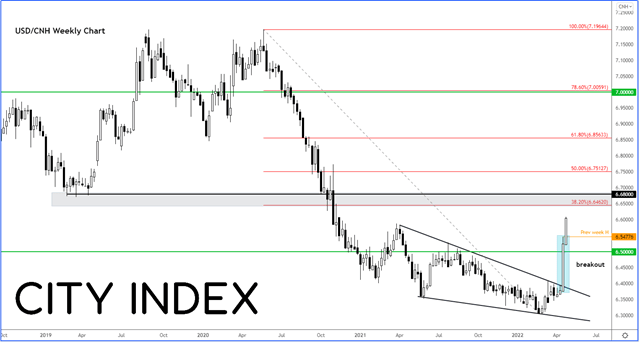
Indeed, fears over the Chinese economy saw the USD/CNH break out from a consolidation pattern last week, leading a big upsurge and follow-up technical buying in this pair (or selling in the yuan):

For as long as the USD/CNH now remains above last week’s high at 6.5477, the short-term path of least resistance would be to the upside, meaning more weakness is likely for the yuan. From here, a move to the shaded region on the chart between 6.65 to 6.70 looks quite likely. Here, the 38.2% Fibonacci level meets prior support-turned-resistance area. I wouldn’t be surprised if this region were to offer only mild resistance, before the rally continues given expectations that monetary policy of the US will further diverge from that of China.
How to trade with City Index
You can trade with City Index by following these four easy steps:
-
Open an account, or log in if you’re already a customer
• Open an account in the UK
• Open an account in Australia
• Open an account in Singapore
- Search for the company you want to trade in our award-winning platform
- Choose your position and size, and your stop and limit levels
- Place the trade


