


The National Bureau of Statistics China (NBS) released PMI data this week which shows both the manufacturing and services sector are expanding.
Appetite for risk has enjoyed a great to start to the year, mostly thanks to China reopening and abandoning their covid-zero policy. It was a key reason as to why the International Monetary Fund (IMF) chose to not downgrade global growth forecasts for the first time in a year, and tentatively call for a ‘turning point’ in the global economy. And that is so far being backed up by data coming from China.
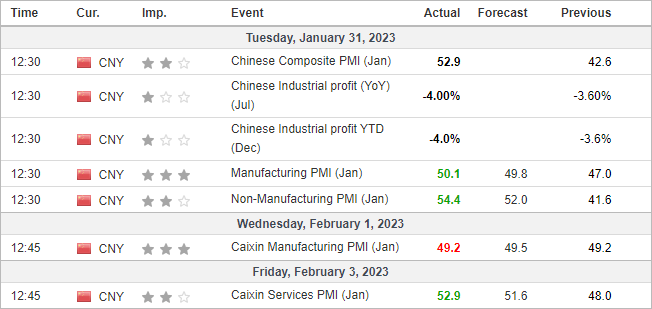
This week we have seen four headline PMI survey released covering manufacturing and services, three of which have beat expectations and expanded. If PMI’s are above 50 is denotes expansion and I favourable for growth prospects in the future. Admittedly manufacturing is the laggard as the NBS print only expanded by 50.1 (and Caixin’s read remains within contraction at 49.2), yet both service PMI’s accelerated higher.
In fact, the NBS service PMI added 12.8 points m/m, which is its highest monthly increase since the depths of the pandemic in 2020.
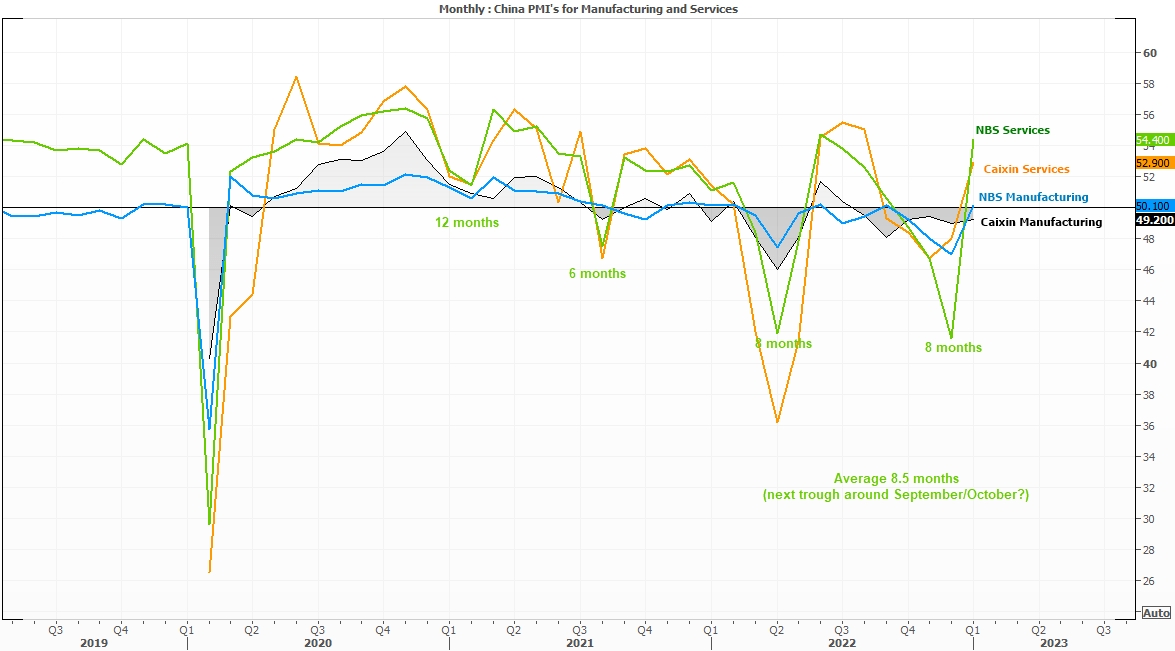
The Caixin prints are a privately run survey, and can be useful to monitor alongside NBS data to get a feel for the overall trend. Something which stands out is that the Caixin survey has mostly had manufacturing within contraction for the nest part for two years, yet their services PMI tends to track the oscillations of NBS and Caixin service PMI’s very well. Given the past four cycle average 8.5 months, which suggests the current business cycle in China could trough around September or October his year. Unfortunately, peaks are far less reliable to measure, but we can see momentum is pointing firmly higher, which bodes well for H1 this year.
USD/CNH yield differentials and daily chart:
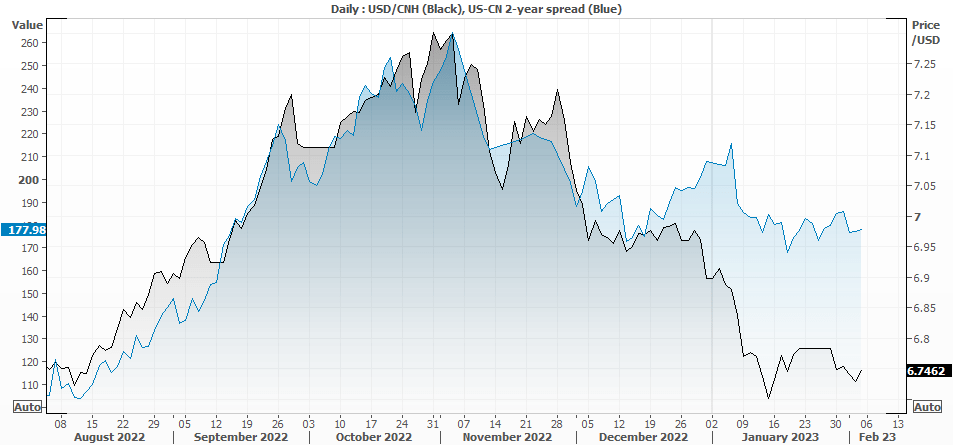
Yield differentials between the US and China 2-year treasury note continue to suggest USD/CNH could be oversold, at least over the near-term. The daily close chart (above in black) also better shows the potential for a higher low, as part of a countertrend move.
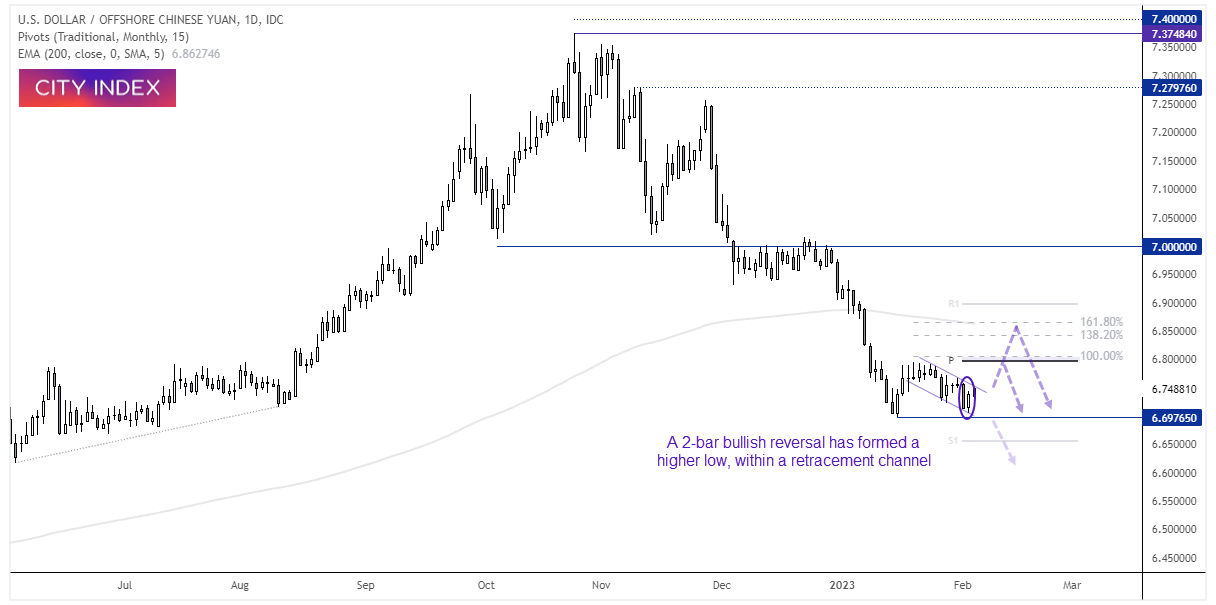
The daily candlestick chart shows a recent pullback has failed to retest the 6.6976 low, and yesterday formed a 2-bar bullish reversal pattern (bullish piercing line). Whilst prices remain within a small retracement channel, we’re now looking for a break higher and minimum move to the highs around 0.6800 (near the monthly pivot point, 100% projection and recent highs).
Should it break higher, then the it has the potential to extend to the 138.2% or 161.8% projection levels, the latter of which is by the 200-day EMA.
Further out, I doubt Beijing will want their currency to depreciate too much given weak export data, so its possible the anticipated move higher is simply a countertrend move which could later break to new cycle lows.
Latest market news
Yesterday 01:23 PM
Yesterday 06:01 AM
April 18, 2024 11:27 PM
Latest Trade Ideas articles

April 18, 2024 11:27 PM
April 18, 2024 04:46 PM