


March 16, 2021 2:43 PM
The China A50 Index had been trading within a symmetrical triangle since May 2015, putting in a series of lower highs and higher lows on a weekly timeframe as price moved towards the apex. On July 6th, 2020, price broke above the downward sloping trendline of the of the top of the triangle, putting in a high of 16,440.9. The China A50 Index then consolidated until price began to move higher in a parabolic fashion, taking out the prior highs and skyrocketing to a new all time high of 20,603.10 in mid-February. The weekly candlestick formation during that period is called an “Evening star formation”, as price made a move higher the week prior to the high, a doji candle during the week of the high, and a move lower the week after the high. This is considered a potential reversal formation. In addition, the RSI was in overbought territory, near 77, another sign of a potential pullback. Indeed, price did pull back and held horizontal support and the prior highs from the July 6th, 2020, as the RSI unwinds back into neutral territory.
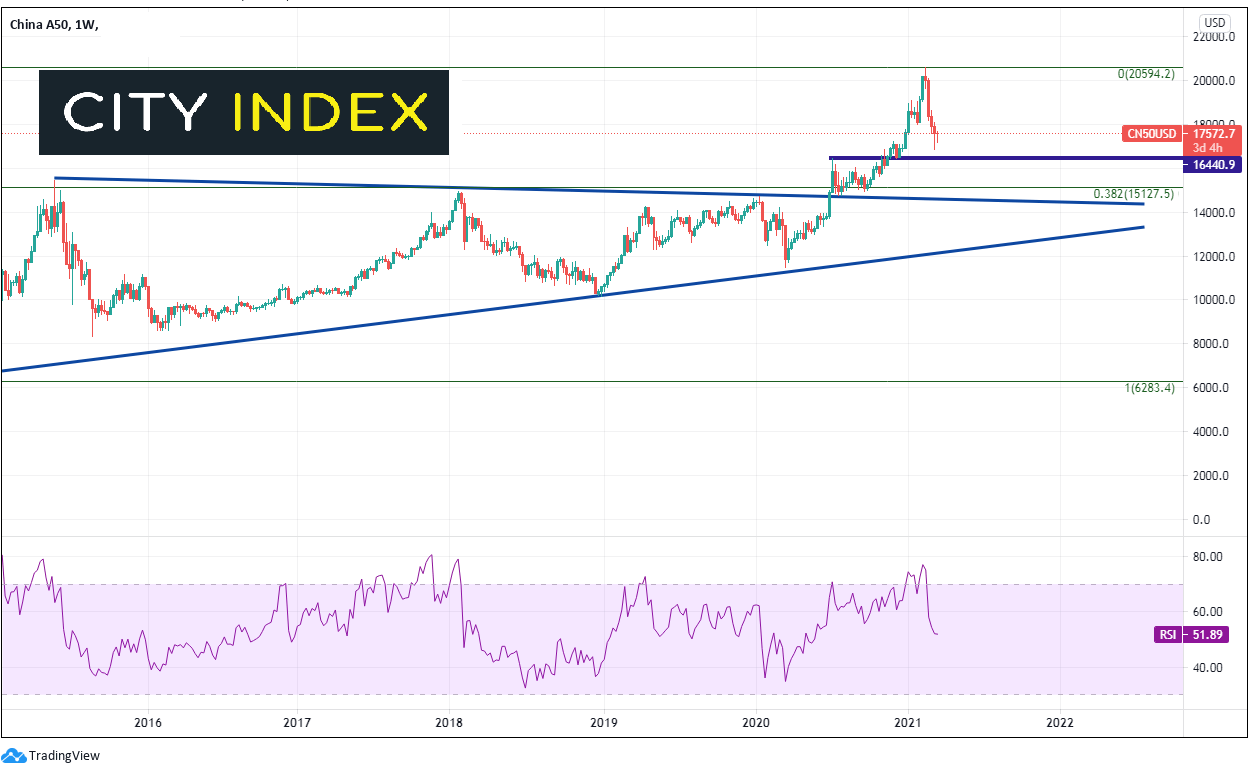
Source Tradingview, City Index
The daily timeframe becomes even more interesting. Since the beginning of 2021, price began to diverge with the RSI in overbought territory. The China A50 Index went on to put in a higher high, while the RSI made a lower higher. This is another indication price may have been ready to pull back. Price did move lower and is at the 38.2% Fibonacci retracement level from the March 19th, 2020 lows to the February 18th highs, near 17,141.2. Below there are the previous highs from July 2020 at 16,449.8 and then the 50% retracement level of the daily timeframe near 16,063.3. If price does bounce from support, there is some short-term horizontal resistance at 17,895. However, price can easily challenge the all-time highs at 20,603.
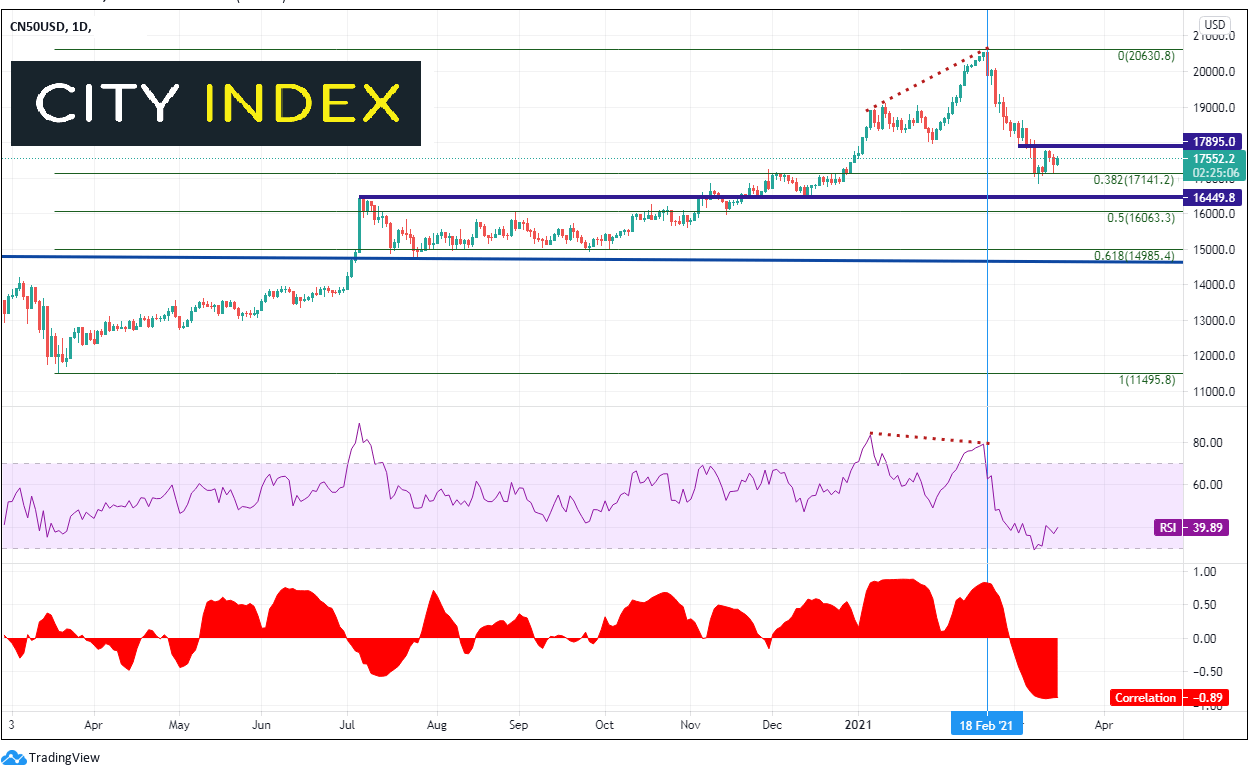
Source Tradingview, City Index
On the bottom of the daily chart is the correlation coefficient between the China A50 Index and the US 10-year yield. The two assets had been positively correlated, and various levels, since the beginning of 2021. However, on the day the highs were posted in the index, the correlation began to rollover and by February 26th, the correlation coefficient between the two assets moved from positive to negative and continued to move further into negative territory. For reference, a correlation of -1.00 means that the two assets move perfectly together on a 1 to 1 basis in opposite directions. A reading of 0.00 means that there is no correlation at all. A correlation of +1.00 means that the two assets move perfectly together on a 1 to 1 basis in the same direction.
Bulls will be watching for the Fibonacci levels and the prior resistance is add to long positions. Bears will be watching for any bounces to 17,895 to short. However, both will be watching the US 10-year yield and its correlation to the China A50 Index. As it stands, a move higher in yields means a possible move lower in the index and a move lower in yields means a possible move higher!
Learn more about index trading opportunities.
Latest market news
Today 08:15 AM
Latest Indices articles

April 18, 2024 04:46 PM
April 17, 2024 11:00 AM
April 16, 2024 08:00 PM