


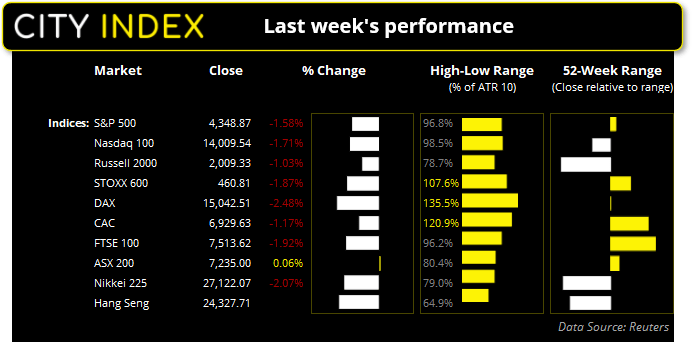


The overriding theme for global indices last week was really quite simple; sell equities. Wall Street fell for a second straight weeks as tensions between Russia and Ukraine escalated, following reports of shells being fired at the Ukraine border. The negative sentiment resulted in all US major indices falling over -1%, but it should also be noted that volatility for the week was below average. One assumption to consider is that the negative news from Russia is getting close to being priced in. And if geopolitical tensions are to recede then it brings with it the potential for markets to rally.
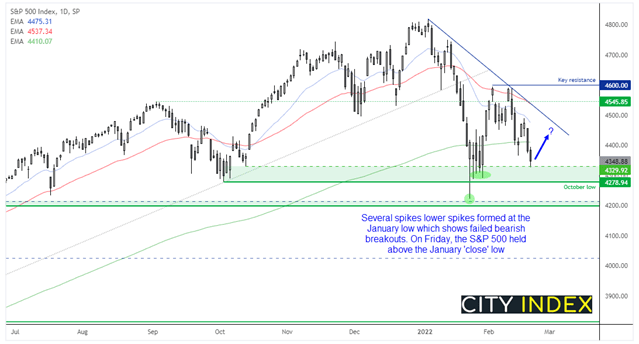
The decline on the S&P 500 stalled just above the January ‘close’ low. This is important as there were several failed attempts to break beneath 4340 which resulted in lower wicks (or ‘buyers bars’). Futures markets have turned lower on news that Biden and Putin have agreed to hold a summit ‘in principle’, and if this is to mark a thawing of geopolitical tensions then Friday could also mark an important swing low.
Please take note that US cash markets are closed today due to a public holiday in the United States.
European bourses stand their ground
Whilst European equities have also faced selling pressures, their selloff has been less profound when compared with their US counterparts. As just one example, the STOXX 600 fell around -8.5% from its record high whilst the S&P 500 fell around -12.5%. And whilst the FTSE has not reached a record high of its own, it trades just -2.65% beneath its year-to-date high. In theory, should sentiment improve then European indices could outperform the US.
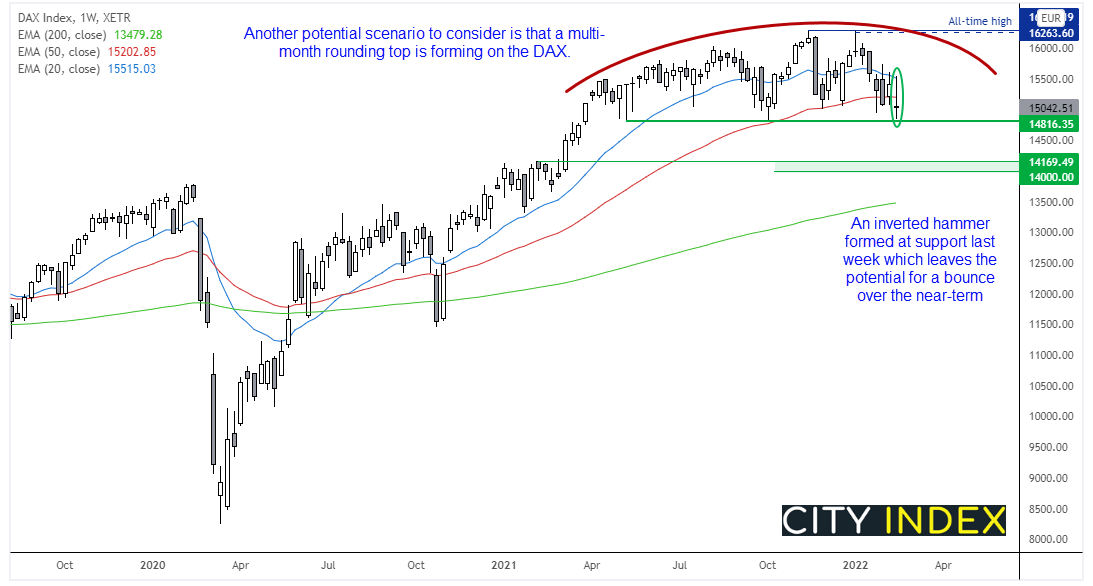
We can see on the DAX weekly chart that prices fell to a 19-week low last week, to the bottom of a 9-month range. Yet despite its volatile week the market closed effectively flat and printed a potential reversal candle (inverted pinbar). News that the US and Russia may hold a summit has seen futures markets open higher so there is chance we could see a risk-on rally. Our near-term bias remains bullish above 14,800 with an initial target around last weeks high near 15,500. Further out, potential scenarios to consider are a multi-month rounding top pattern which would be confirmed with a break below 14,816.
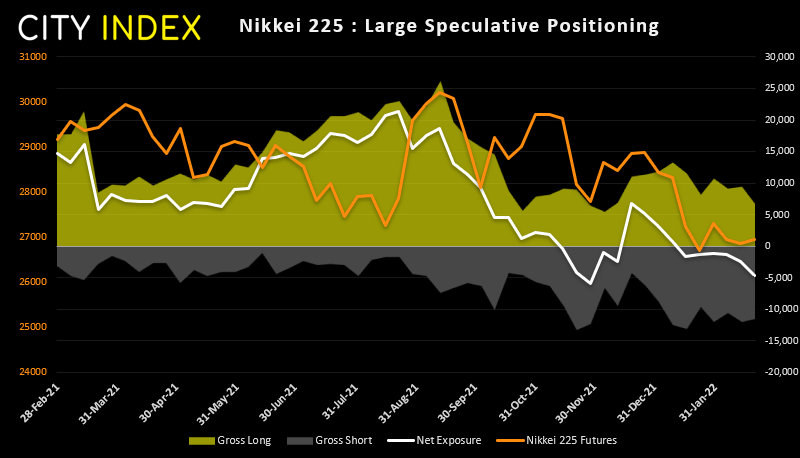
Nikkei futures positioning (priced in yen):
Traders were net-short Nikkei futures for a sixth consecutive week and are at their most bearish level since November 2020. There are currently 1.68 short bets for every long, which is its most aggressively bearish ratio in 15-months. Another sign that all is not well is that foreign investors were net-sellers of both bonds and equities last week.
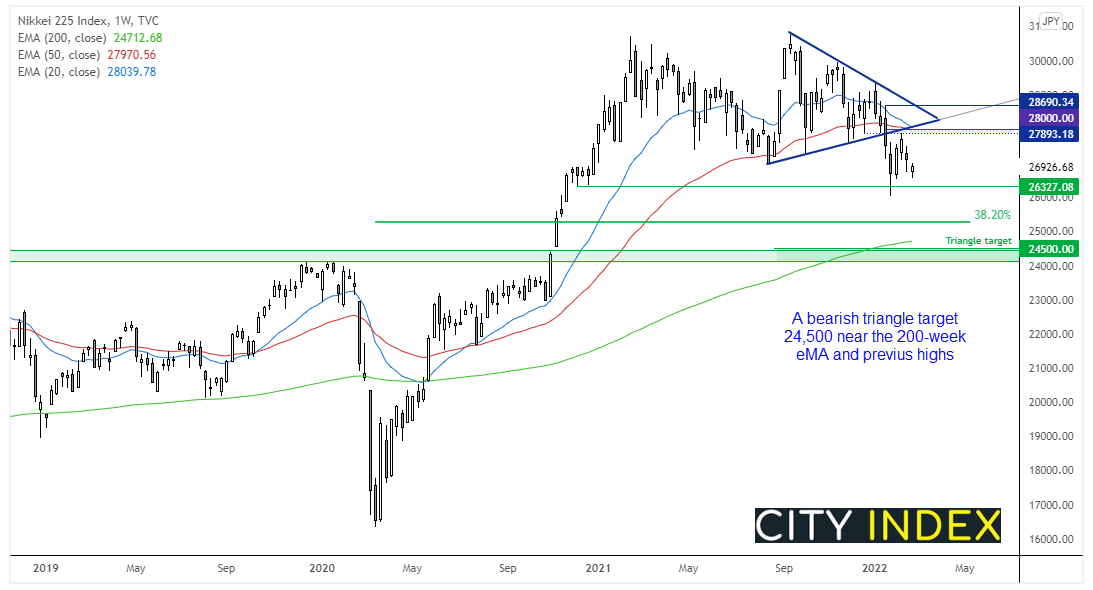
Nikkei 225 index:
A bearish triangle breakout remains in play on the Nikkei 225 which targets 24,500. Should prices get to such low levels, we would expect it to provide strong support as it is near several important technical levels such as historic highs and the 200-week eMA.
However, prices are currently holding above the December 2020 low and downside momentum is waning. Like Wall Street, it is vulnerable to a bounce over the near-term should a resolution to the Russia-Ukraine crisis materialise.
Read our guide on the Nikkei 225 trading guide
How to trade with City Index
You can trade easily trade with City Index by using these four easy steps:
-
Open an account, or log in if you’re already a customer
• Open an account in the UK
• Open an account in Australia
• Open an account in Singapore
- Search for the company you want to trade in our award-winning platform
- Choose your position and size, and your stop and limit levels
- Place the trade
Latest market news
Today 01:15 PM
Today 07:49 AM
Latest Indices articles


Yesterday 06:08 AM
April 14, 2024 04:00 AM