


AUD/USD takeaways
- Another round of soft Chinese PMI figures overnight has traders questioning whether a delayed recession could strike in the second half of the year.
- Risk-sensitive currencies, especially those in the Asian-Pacific region like the Australian dollar, are particularly vulnerable to this scenario.
- AUD/USD is at 2023 lows and trending clearly lower, with little in the way of support until below 0.6400.
Australian dollar fundamental analysis
Overnight, China released some rather jarring PMI figures that suggest its reopening burst of economic activity may be waning already.
The planet’s second-largest economy (and Australia’s most important trade partner) saw another outright contraction in manufacturing activity this month, with Manufacturing PMI printing at 48.8 vs. 49.5 expected and 49.2 last month; the Non-Manufacturing PMI figure also missed expectations at 54.5 vs. 55.1 expected and 56.4 last month.
Paired with this week’s big drop in indices and oil prices, the downbeat data out of China points to slowing demand as we head into the middle of the year, a possible harbinger of a recession in the second half of 2023. When it comes to the FX market, that means risk-sensitive currencies, especially those based in the Asian-Pacific region like the Australian dollar, may be vulnerable.
Australian dollar technical analysis – AUD/USD daily chart
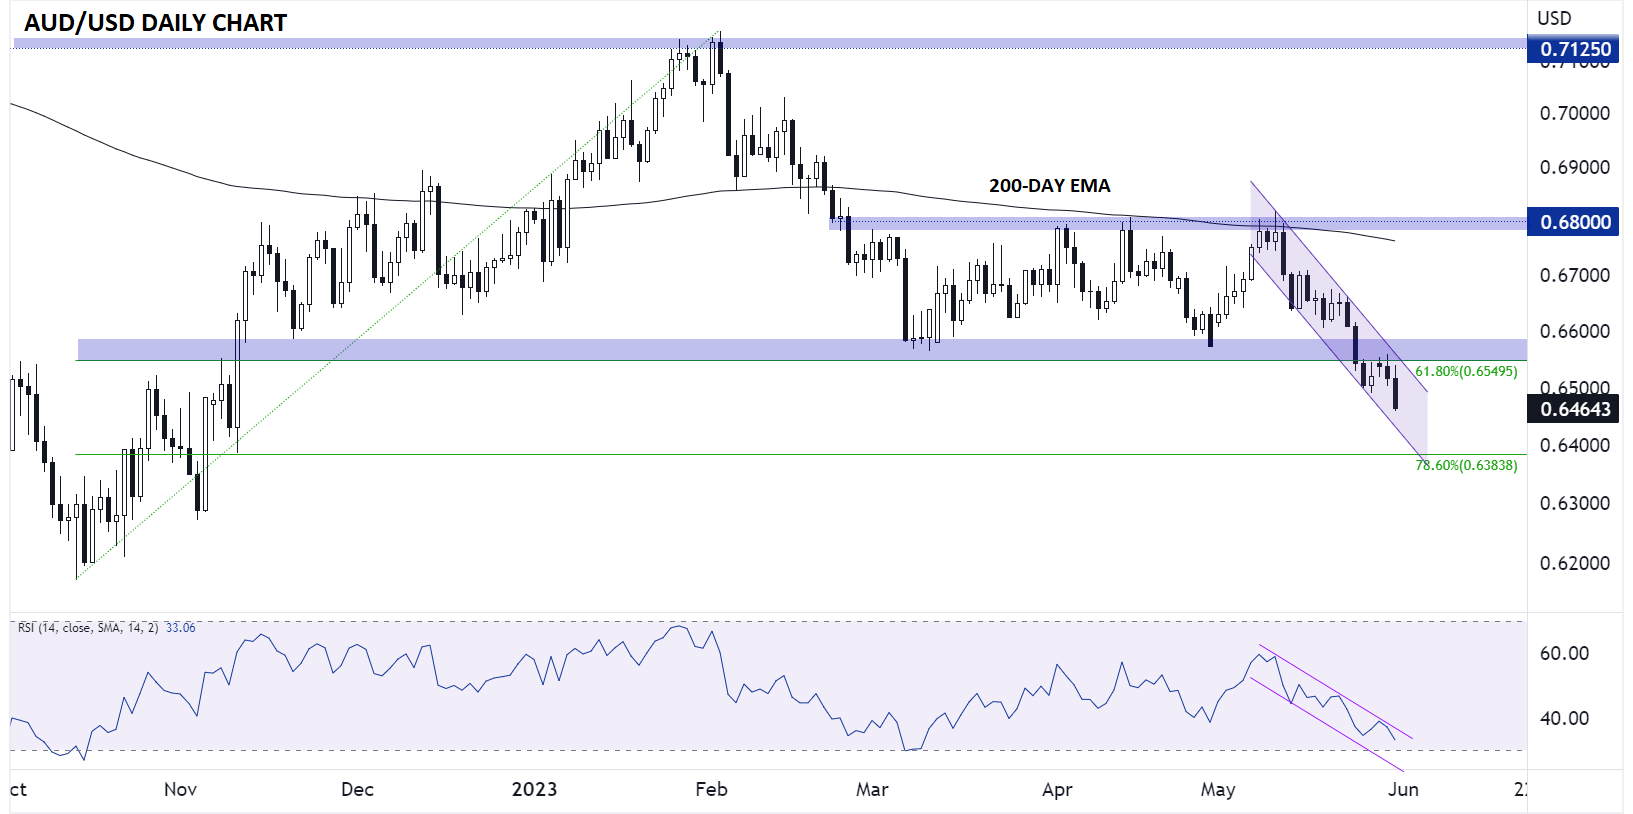
Source: Tradingview, StoneX
As the chart above shows, AUD/USD broke down below clear previous support in the upper-0.6500s last week. The pair then retraced back up to retest that area from the underside before putting in a bearish engulfing candle yesterday. For the uninitiated, a bearish engulfing candle shows a big shift to selling pressure and is often seen at near-term tops in the market.
With today’s selloff taking the pair below last week’s trough to the lowest level of the year, there’s little in the way of nearby support until the 78.6% Fibonacci retracement of the October-February rally below 0.6400.
As long as the bearish channel holds, the path of least resistance remains to the downside for AUD/USD. Only a sharp rally back toward the 0.6600 area would erase the near-term bearish bias.
-- Written by Matt Weller, Global Head of Research
Follow Matt on Twitter: @MWellerFX
How to trade with City Index
You can trade with City Index by following these four easy steps:
-
Open an account, or log in if you’re already a customer
• Open an account in the UK
• Open an account in Australia
• Open an account in Singapore
- Search for the market you want to trade in our award-winning platform
- Choose your position and size, and your stop and limit levels
- Place the trade
Latest market news
Yesterday 08:33 AM
Latest AUD USD articles
April 17, 2024 11:16 PM
April 16, 2024 10:19 PM
April 9, 2024 11:02 PM
April 8, 2024 10:56 PM