


August 18, 2022 4:29 AM
The Australian jobs report for July has provided a messy mix. The unemployment rate fell to a 48-year low of 3.4%, despite the economy shedding 40,900 jobs, snapping a run of eight consecutive months of gains.
Behind the fall in the unemployment rate from 3.5% to 3.4%, the participation rate defined tas he percentage of people in the working-age population in the labour force, declined from last month’s record high of 66.8% to 66.4%. This means fewer people were looking for jobs.
As noted in the ABS media release, the July reference period coincided with the winter school holidays, worker absences associated with COVID and other illnesses, and other flooding events in New South Wales.
“During the pandemic, it has not been uncommon to see larger-than-usual changes or slowing in employment and hours around school holidays,” Mr Jarvis said.
In terms of other details, labour market capacity as defined by the underutilization rate fell 0.2 pts to 9.4% to its lowest level since 1982. The underemployment rate, which measures the number of people who hold a job but want more hours decreased by 0.1% to 6% and is now 2.3 pts below where it started the year.
Holiday distortions aside, the fall in the unemployment rate to 3.4% reflects a tight labour market, supported by still high job vacancies and reports of ongoing labour shortages. All of these will flow into a lower unemployment rate, and higher wages, inflation and inflation expectations.
As a result, the RBA will likely raise rates by 50bp at its meeting in September, which would take the cash rate to 2.35%, near the nominal neutral rate of around 2.5%.
The RBA have already delivered 175 bp of hikes since May, the risk is that the RBA may opt for a more modest 40pb or 25bp rate hike. The interest rate market is 100% price for a 40bp hike.
What does it mean for the AUDUSD?
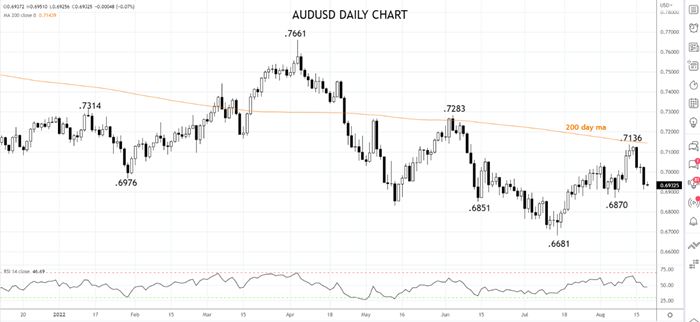
The AUDUSD initially fell 25 pips from .6947 to .6927 following the data release, before steadying around .6935.
Following the rejection from the .7136 high and the 200-day moving average currently at .7143, there is scope for the AUDUSD to test a cluster of lows in July and August .6870/50 area. On the topside, sellers are likely to emerge on bounces towards .7000c and again at .7150.
Source Tradingview. The figures stated are as of August 18th 2022. Past performance is not a reliable indicator of future performance. This report does not contain and is not to be taken as containing any financial product advice or financial product recommendation
How to trade with City Index
You can trade with City Index by following these four easy steps:
-
Open an account, or log in if you’re already a customer
• Open an account in the UK
• Open an account in Australia
• Open an account in Singapore
- Search for the company you want to trade in our award-winning platform
- Choose your position and size, and your stop and limit levels
- Place the trade
Latest market news
Today 01:15 PM
Today 07:49 AM
Latest jobs articles
February 1, 2024 04:02 PM
March 22, 2023 09:38 AM
January 24, 2023 07:42 AM
January 5, 2023 03:39 PM