


Asian Futures:
- Australia's ASX 200 futures are down -13 points (-0.19%), the cash market is currently estimated to open at 6,695.20
- Japan's Nikkei 225 futures are down -160 points (-0.54%), the cash market is currently estimated to open at 29,632.05
- Hong Kong's Hang Seng futures are up 107 points (0.37%), the cash market is currently estimated to open at 29,097.94
UK and Europe:
- The UK's FTSE 100 futures are down 0 points (0%)
- Euro STOXX 50 futures are down -31 points (-0.81%)
- Germany's DAX futures are down -162 points (-1.09%)
Friday US Close:
- The Dow Jones Industrial fell -243.33 points (-0.71%) to close at 32,627.97
- The S&P 500 index fell -2.36 points (-0.07%) to close at 3,913.10
- The Nasdaq 100 index rose 77.845 points (0.61%) to close at 12,866.99
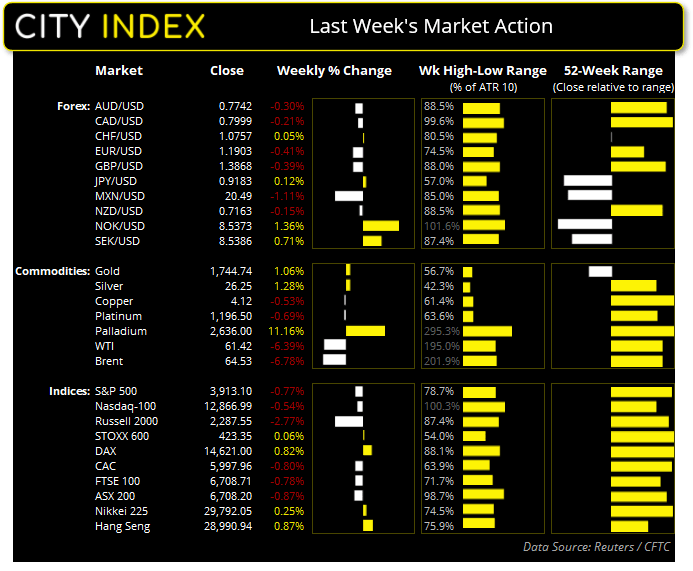
Indices: Down, but not out
The Nasdaq survived the week above 12,755 support, despite a minor attempt to break it on Friday and 4% sell-off on Thursday. Why? Because bond yields fell. But Friday’s ‘rally’ as small at best and the week closed with a bearish hammer between the 10 and 20-week eMA’s. Therefore, a downside break of said support is not out of the question this week unless bulls can regain control sooner than later.
The S&P 500 remains above its 20-day eMA and just below its 10-day, after forming a small indecision candle on Friday (Rikshaw Man Doji). The Russel 2000 finds itself in a similar position, although Tuesday and Thursday’s bearish engulfing candles are clearly more prominent. Ultimately, all US indices closed lower last week.
The ASX 200 has remained in the 6650 – 6800 range for the past four weeks. The last three days of last week were bearish and it trades just above 6650. So until momentum break s below 6650 or above 6800, range trading strategies are preferred (incidentally AUD/USD find itself in a similar scenario).
Learn how to trade indices
Forex: Fed gave the dollar a wee boost on Friday
US dollar index (DXY) closed to an 8-day high on Friday after the Federal Reserve said they will remove a temporary rule which forced larger banks to hold higher capital requirements. It was implemented in response to market turbulence due to the pandemic and is due to be removed after 31st March.
- Still, DXY went on to close beneath Tuesday’s high after a false break above 92.03 and produced an indecision candle (Spinning top doji) by the close.
- AUD/USD found support at its 50-day eMA on Friday but closed lower for a second consecutive session. It is effectively rangebound between 0.7705 – 0.7838, so range trading strategies could be the way forward (or sideways in this case) until a breakout of the range is achieved.
- NZD/JPY produced a bearish outside candle on Thursday at 79.21 resistance and just below the April 2018 high. Given its strong move for the next part of a year we suspect it will be time for a period of consolidation or a retracement before its trend resumes.
- AUD/NZD tried but failed to break above 1.0843 resistance. We had been waiting for it to roll over, as it had previously down around 1.0800 a couple of times this year but its price behaviour around current levels has changed. We are therefor on guard for a bullish breakout once its current period of compression has finalised. If prices can hold above Friday’s inside candle then any upside break should be taken seriously.
- NZD/CAD produced two consecutive inside bars within Wednesday’s range to show compression is underway. Given its bearish trend on the daily chart we are keeping an eye for a potential bearish breakout beneath 0.8926.
EUR/NZD: What can’t go down, must go….
EUR/NZD has been in a downtrend for the past year. However, price action is now leaving a trail of clues that it may try a pop higher as part of a countertrend move.
After breaking beneath the July 2019 low and failing to test the March 2019 low, a bullish reversal occurred as part of a bear-trap at the lows. Since then, prices have drifted sideways yet the bearish trendline has capped as resistance, but Thursday’s bullish close shows demand at 1.6488 and warns of a higher low.
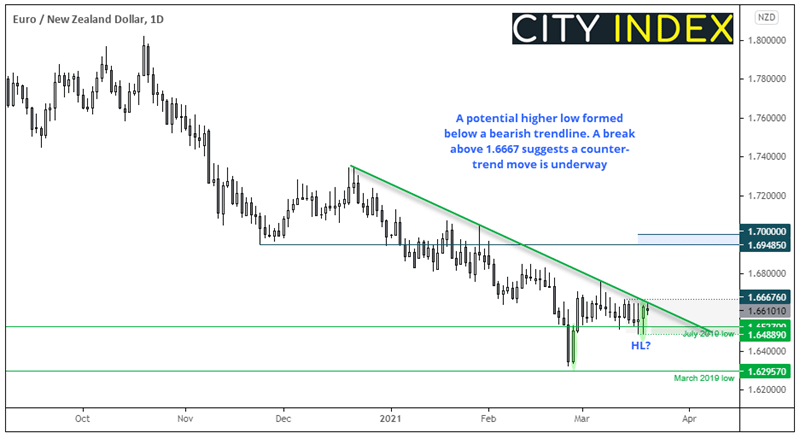
- Should prices break the trendline and the 1.6667 high we suspect a retracement would be underway.
- Bulls could wait for a break above 1.6667 to confirm a bullish breakout.
- The bias remains bullish above 1.6488, so the bias becomes invalidated if prices break beneath this support level.
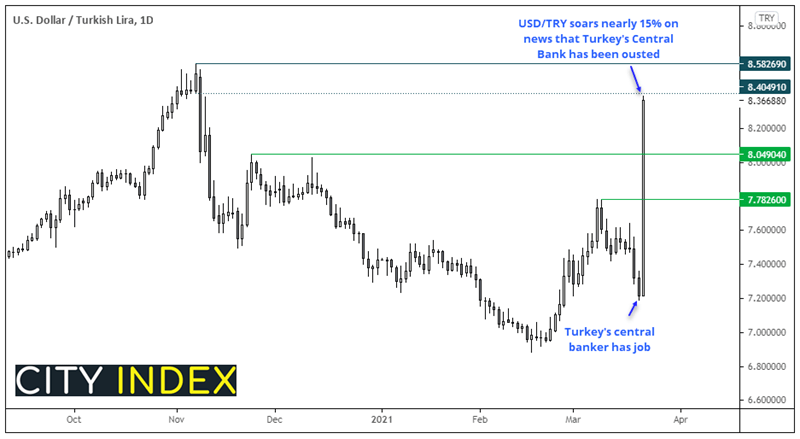
Erdogen sends the Turkish Lira into freefall
USD/TRY has risen an eyewatering 14.8% this morning after Turkey’s President Erdogan has fired his latest Central Banker. Now on his third culling since July 2019, it is the latest twist which undermines confidence in the central bank and government. The now ousted governor Naci Agbal was guilty of raising interest rates three days ago to fend off soaring inflation (which is generally agreed to be the right thing to do with doble digit inflation). This classic central bank move bought his 5-month term was bought to a swift end. He will be replaced by Sahap Kavcioglu, a vocal critic of high interest rates and former member of Erdogan’s ruling AK Party. USD/TRY moved from around 0.7200 to 0.8400 at market open as the Turkish Lira went into freefall.
Commodities: Palladium steals the limelight
WTI futures found bounced of the 50-day eMA during Thursday’s -7% sell-off, then Friday produced a bullish inside bar from 59.24 support and re-tested a broken trendline on the daily chart. From here bears need to decide whether to regain control and force prices to new lows, so we’ll keep a close eye on price action around the said trendline. But for our bullish bias to return we’d prefer to wait for at least a break of 63.13.
Gold produced a small bullish inside day on Friday, but until we see a clear break above the 1760/64 resistance zone the risk remains for another dip lower towards 1700. Yawn.
Anyway, of much more interest last week was Palladium’s 11% rally after it broke out of a multi-month range. Friday produced a (relatively) small bearish inside candle to suggest a period of consolidation or retracement is on the way. We remain bearish above 2500 but, at this stage, doubt a retracement may reach that far so will watch for a series of small compression candles as this warns that a burst of volatility could await (which will hopefully be to the upside).
Weekly COT report (Commitment of Traders)
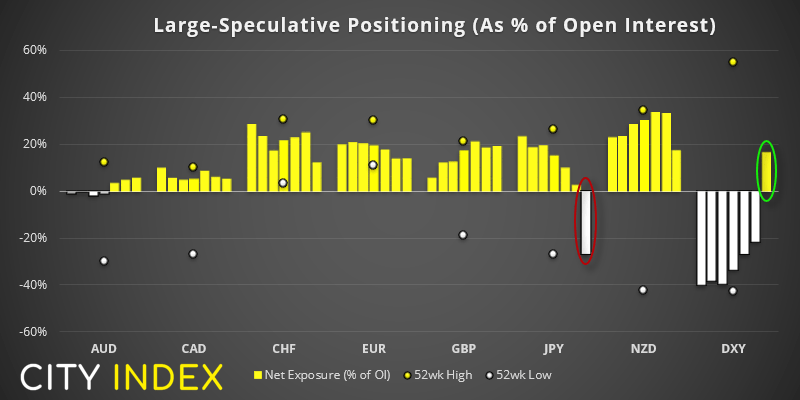
As of Tuesday 16th March 2020:
- US dollar index (DXY) flipped to net-long exposure for the first time since June 2020. Adding over 14.95k contracts to net-long exposure last week, it was its largest weekly increase since October 2016.
- And at the other end of the scale is the Japanese yen, which saw large speculators flip to net-short exposure for the first time since just over a year.
- Traders reduced bullish exposure to euro futures for a fourth consecutive week
- There was a large dop in net-long exposure of NZD futures last week, which saw -12.6k contracts trimmed last week.
- The Swiss franc also lost it appeal with traders reducing net-long exposure by -10.3k contract, taking bullish exposure to its lowest level since October 2020.
- Gold futures traders increase their net-bullish exposure for the first week in seven, by a mere +5k contract.
View more COT charts on our Twitter thread
Up Next (Times in AEDT)
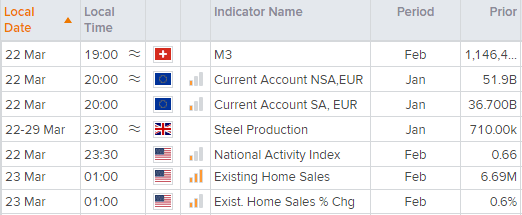
You can view all the scheduled events for today using our economic calendar, and keep up to date with the latest market news and analysis here.
- It’s a very quiet calendar today, across all regions. It could be a quiet start to the week.
- Jerome Powell speaks for his first of three events this wee at 23:00 AEDT. Titled “How Can Central Banks Innovate In The Digital Age”, which is likely to catch the attention of crypto traders.
Latest market news
Today 11:14 AM
Today 08:28 AM
Yesterday 03:30 PM
Latest Indices articles

Yesterday 03:30 PM
April 18, 2024 04:46 PM