


Asian Futures:
- Australia's ASX 200 futures are down -33 points (-0.44%), the cash market is currently estimated to open at 7,501.90
- Japan's Nikkei 225 futures are down -80 points (-0.28%), the cash market is currently estimated to open at 28,009.54
- Hong Kong's Hang Seng futures are down -60 points (-0.23%), the cash market is currently estimated to open at 25,818.99
UK and Europe:
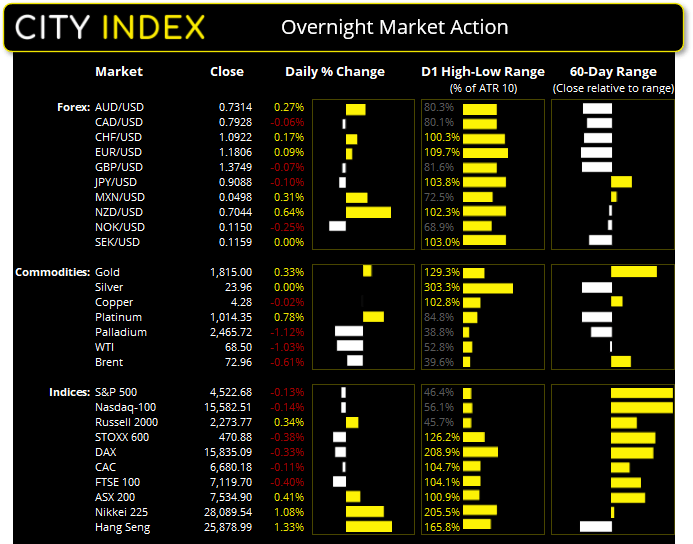
- UK's FTSE 100 index fell -28.31 points (-0.4%) to close at 7,119.70
- Europe's Euro STOXX 50 index fell -2.39 points (-0.06%) to close at 4,196.41
- Germany's DAX index fell -52.22 points (-0.33%) to close at 15,835.09
- France's CAC 40 index fell -7.12 points (-0.11%) to close at 6,680.18
Tuesday US Close:
- The Dow Jones Industrial fell -55.96 points (-0.16%) to close at 35,399.84
- The S&P 500 index fell -6.11 points (-0.14%) to close at 4,522.68
- The Nasdaq 100 index fell -22.575 points (-0.14%) to close at 15,582.51
Learn how to trade indices
Indices hold their ground despite weaker consumer sentiment:
US confidence fell -11.3 points in August, it’s worst decline in 16-months as the rise of the Delta variant and soaring house prices dented sentiment. Taken alongside the University of Michigan read which fell at its fastest pace in over 10-years, it paints a potentially dire picture for the consumer-driven economy should sentiment continue to deteriorate.
Yet indices remained firmly around their highs as this plays into the dovish stance of the Fed and their decision to not announce tapering at Jackson Hole. The Nasdaq 100 and S&P 500 were around -0.13% lower for the day and trade just off their record highs (both indices printed intraday record highs). Energy stocks were lower with oil prices.
The ASX 200 rose to a 2-week high yesterday before finding resistance at the 61.8% Fibonacci retracement between the August low and all-time high. A positive GDP report could help boost sentiment for the local market, although bulls aren’t exactly dominating the index just yet and the current rally could be the last wave of an ABC countertrend move. Should momentum turn lower then support resides around 7500 / bullish trendline.
ASX 200 Market Internals:

ASX 200: 7534.9 (0.41%), 31 August 2021
- Information Technology (1.87%) was the strongest sector and Utilities (-1.19%) was the weakest
- 8 out of the 11 sectors closed higher
- 5 out of the 11 sectors closed lower
- 6 out of the 11 sectors outperformed the index
- 137 (68.50%) stocks advanced, 58 (29.00%) stocks declined
- 70.5% of stocks closed above their 200-day average
- 63.5% of stocks closed above their 50-day average
- 61% of stocks closed above their 20-day average
Outperformers:
- + 10.7% - Clinuvel Pharmaceuticals Ltd (CUV.AX)
- + 6.97% - Appen Ltd (APX.AX)
- + 5.73% - WiseTech Global Ltd (WTC.AX)
Underperformers:
- -15.9% - Mesoblast Ltd (MSB.AX)
- -3.76% - Worley Ltd (WOR.AX)
- -3.52% - Regis Resources Ltd (RRL.AX)
Forex: AU GDP scheduled at 11:30 AEST
The New Zealand dollar was the strongest currency as COVID-19 cases continued to drop after implementing hard and fast lockdowns for the Nation. New cases have fallen two days in a row to 49 as of yesterday (down from 53 on Monday ad 83 on Sunday).
Should New Zealand continue and contain the virus and go on to remove restrictions sooner than later then bets are back on for RBNZ to raise interest rates. Markets had already priced in a hike for their August meeting but the single cases identified the day before the central bank OCR decision saw RBNZ hold off from tightening.
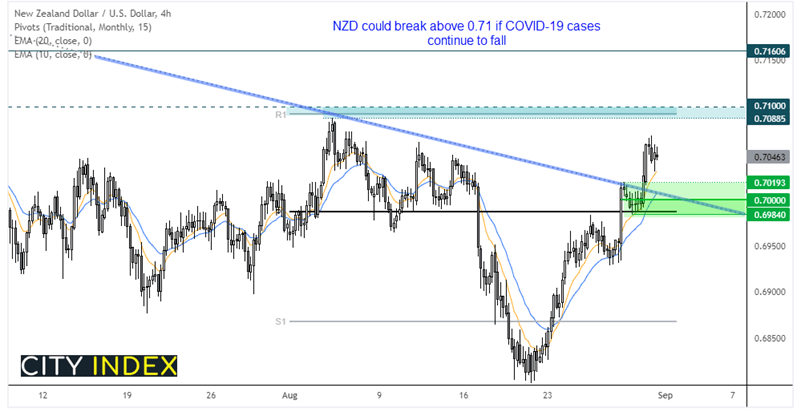
NZD/USD closed back above 70c, the 50-day, 200-day eMA’s and trend resistance (projected from the May high). The next target for bulls is around 0.7088 - 0.7100 where the monthly R1 and August high reside. Our bias remains bullish above the 0.6984 low and for an eventual break above 0.7100.
GBP/NZD is probing trend support on the daily chart around 1.9500, so a pivotal area to monitor. Should prices continue to fall then next major support is around 1.9170 – 1.9200.
AUD/USD found support at 0.7300 overnight, and all eyes are on Australian GDP scheduled at 11:30 AEST today. Growth is expected to fall to 0.5% QoQ from 1.8%m or come in flat at 0% YoY from 1.1%.
The US dollar index was slightly lower at -0.03%, having recouped most earlier losses and found support at the monthly pivot point and 50-day eMA. Whilst this may not be enough to warrant a bullish position alone, it does warrant caution for bear over the near-term.
Learn how to trade forex
Commodities:
WTI fell around -1% and closed the month lower for the first time since March. However, Monday’s gravestone Doji below 0.70 warned of this potential scenario, whilst expectations for OPEC+ to increase output and hurricane helped oil prices lower. For now, we’ll wait for any sigs of a swing low to suggest the retracement is complete. We don’t think we’re there yet.
Gold continues to hold above the 1800 – 1805 support zone, having since held above the broken trendline, 200-day eMA and monthly pivot point yesterday. Two bullish hammers have formed on the 4-hour chart and, as a correction has been seen with 3-waves then it’s possible they low has been seen. A direct break beneath 1800 brings that view into question.
Up Next (Times in AEST)
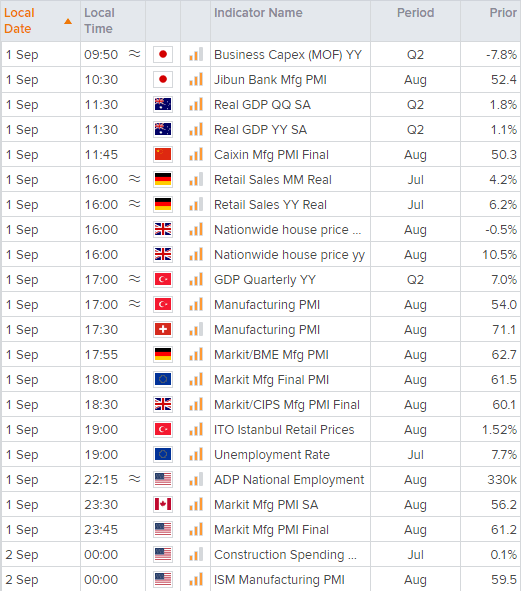
You can view all the scheduled events for today using our economic calendar, and keep up to date with the latest market news and analysis here.
How to trade with City Index
Follow these easy steps to start trading with City Index today:
- Open a City Index account, or log-in if you’re already a customer.
- Search for the market you want to trade in our award-winning platform.
- Choose your position and size, and your stop and limit levels.
- Place the trade.
Latest market news
Yesterday 11:09 PM
Yesterday 11:01 PM
Yesterday 04:00 PM
Yesterday 01:15 PM
Yesterday 11:30 AM
Yesterday 08:18 AM
Latest Indices articles
April 18, 2024 04:46 PM
April 17, 2024 11:00 AM
April 16, 2024 08:00 PM
April 16, 2024 04:54 PM