


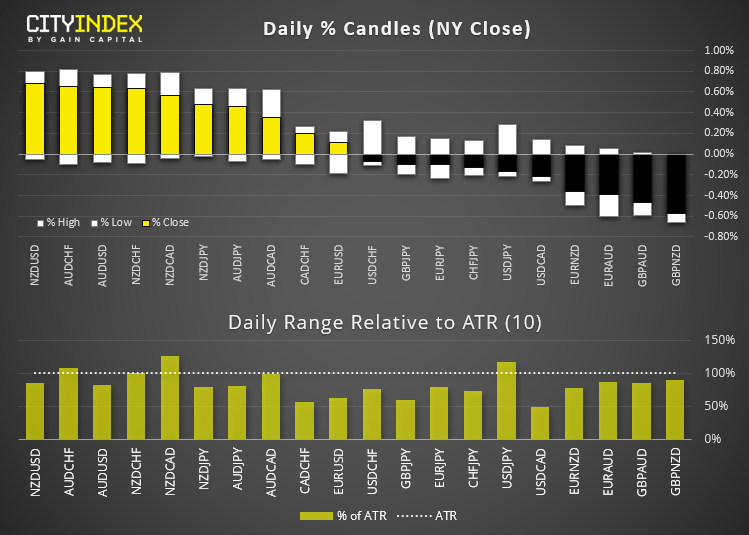
Overnight trade provided a positive tone overall, although volatility wasn’t exactly wild with excitement. The Australian and New Zealand dollar are the strongest majors this week, the USD is the weakest and commodity prices continue to rise with the CRB index (commodity index) hitting a fresh 13-month high.
Cleveland’s Fed President, Loretta Mester, reiterated to traders that they can expect the Fed’s policy to remain accommodative “for a very long time” which helped push stock market indices to fresh highs. Expectations for Biden’s stimulus package also provided a tailwind for stocks, although it should be noted that volatility was low overall.
Gold enjoyed its second bullish session and closed above 1,800 and its 200-day eMA. Yet with price action remaining erratic overall we do not yet feel confident that the corrective phase has neared completion. Over the foreseeable future, gold may be better suited for intraday traders until a decisive trend is established on the daily chart.
The US dollar index (DXY) has found support around its 10 and 50-day eMA. Yet as Friday’s selloff (a bearish engulfing day) clouds sentiment we cannot write off its potential to break lower. Equity markets may hold the key to help decipher the dollar’s next directional move, as higher stocks typically point towards a weaker dollar. But there’s an alternative scenario. With US indices currently sitting at all-time highs and printing an unusually small bullish candle, one should question if there is an appetite for higher stocks at current levels. And if there isn’t, we could see indices correct lower and provide a level of support for the dollar.
Elsewhere, USD/JPY continues to dance to its own beat and trade in a corrective manner after enjoying an impressive bullish run last week. A second bearish hammer has formed on the daily chart, prices have closed firmly beneath the 200-day eMA and the stochastic oscillator has produced a bearish sell-signal. But that is not to say we see further downside as the easier trade. We remain bullish on the pair overall but would prefer to wait for the correction to play out and seek bullish setups once a new level of support has been found.
Does WTI have the energy to break above $60?
WTI extended its lead to trade higher for a sixth consecutive session. Although we to err on the side of caution for extended gains as prices now reside around the 100 and 200-month eMA’s. Currently trading at 57.96, it’s not unreasonable to assume that bulls may be tempted to offload bets as they approach the $60 level. Whilst that is no reason alone to be bearish on oil, we wouldn’t be betting the house on higher prices around current levels. Fundamentally the case points to higher prices but we suspect it may need a corrective phase (or even a period of consolidation) before it breaks above $60.
Tesla pumps bitcoin
Bitcoin broke to a new record high on reports that Tesla Inc purchased $1.5 billion of the cryptocurrency. Oh, and that the company would begin accepting bitcoin as payment for their vehicles. This news may not be too surprising given Elon Musk temporarily changed his twitter name to ‘bitcoin’ last week, only to see the cryptocurrency spike immediately higher.
ASX 200: 7,000 could prove to be a tough level to crack
The ASX 200 has stalled at an important resistance level and price action now needs to decide whether it will break above resistance or enter a phase of mean reversion. Whilst it’s still early in the month the index is currently on track for a bullish engulfing candle. Yet resistance has been found around 6,893.70 which marks the February lows and November 2019 highs. Around current levels we would prefer to step aside and wait to see if bearish momentum returns or we are presented with a daily close above this key level. And given the dizzy heights on US indices on low volatility we are now questioning whether bulls will try to unload their bets.
GBP/CHF: Prices breakout of a multi-month basing pattern
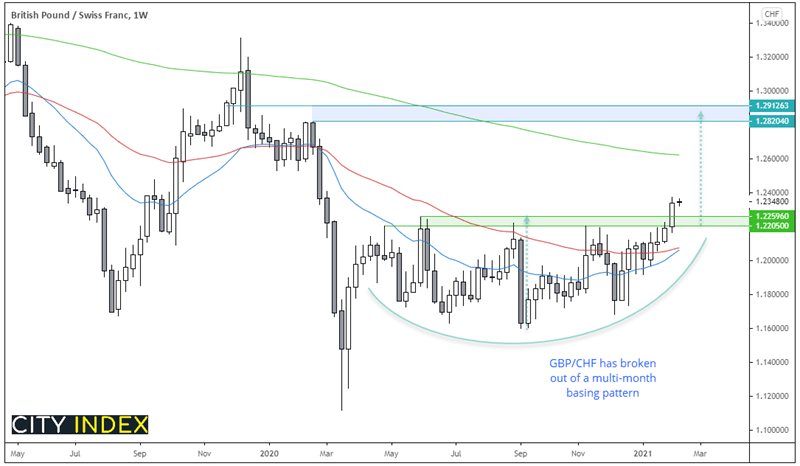
GBP/CHF closed to its highest level in 10-month last week. The firm bullish close also broke out of a multi-month basing pattern which, if successful, suggests it could be headed for 1.2912. The 20 and 50-week eMA’s have converged and point higher, so we’re keen to explore bullish opportunities going forward.
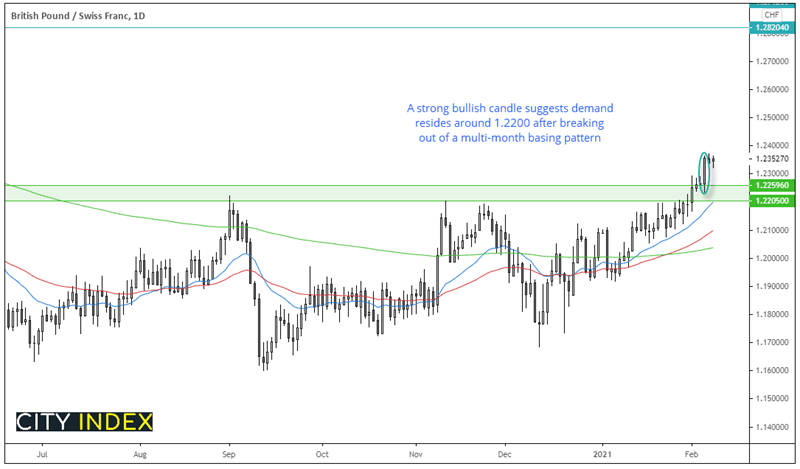
Switching to the daily chart shows a strong bullish trend, and Thursday’s elongated bullish candle shows demand resides around 1.2230. Two small daily candles have since formed to show the market is under compression, so we are no on guard for its next bout of volatility.
- Bulls could consider buying dips above the 1.2200 – 1.2260 support zone. Alternatively, a break above Monday’s high assumes bullish continuation.
- Any signs of bearish volatility returning would place this on the backburner and a break beneath 1.2200 would remove it from the watchlist.
- Whilst the basing pattern projects a target around 1.2900 and our core bias is bullish, we don’t expect it to rise in a straight line. Therefor, we shall consider low volatility retracements as potential long opportunities.
Up next: (Sydney GMT +11)
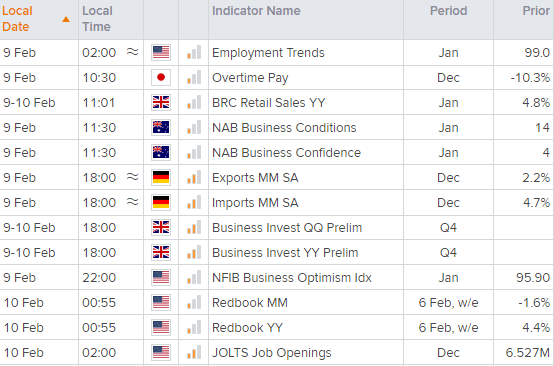
It’s a relatively quiet calendar today, so unless we are presented with a new catalyst, we may find trading ranges to be below average.
Latest market news
Latest Equities articles
April 12, 2024 02:28 AM
April 7, 2024 08:46 PM
March 31, 2024 11:22 AM
