


October 18, 2021 9:27 PM
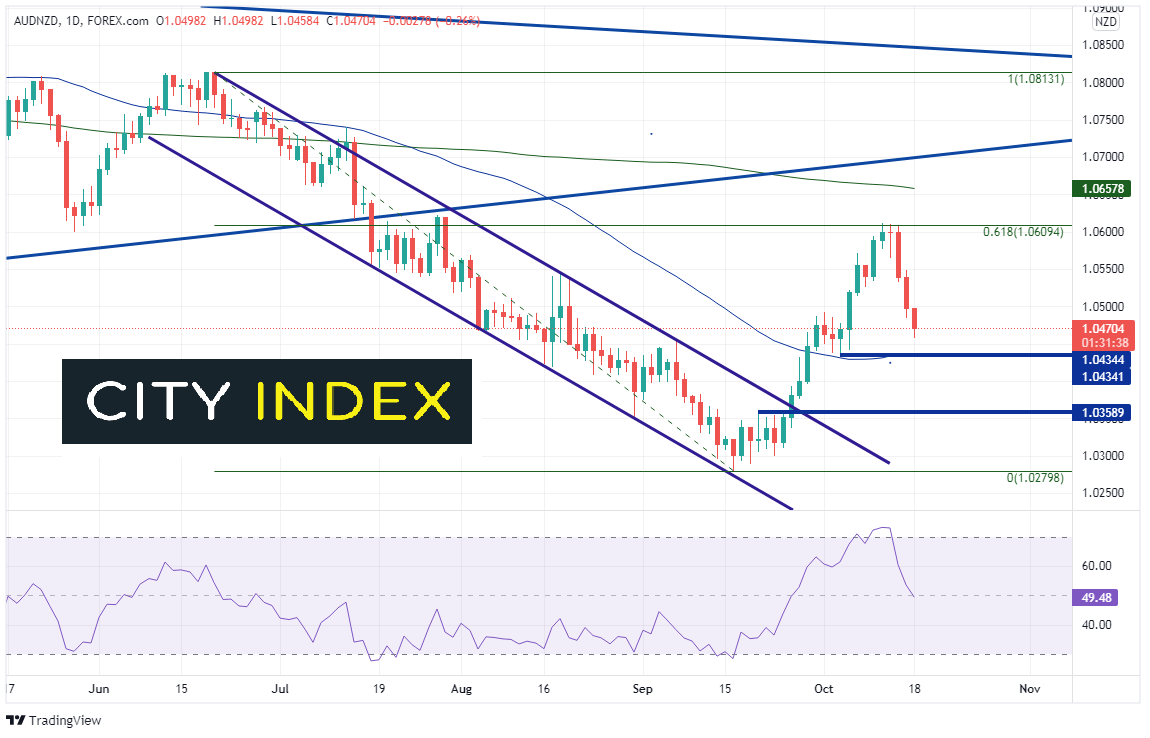
AUD/NZD had been moving lower on the first day of summer in the Northern Hemisphere as coronavirus outbreaks put Aussie traders on notice that poor economic data was ahead. As lockdowns and restrictions were put in place in Australia, AUD/NZD moved lower in an orderly downward sloping channel from a high on June 21st of 1.0813 to a low on September 16th at 1.0280.
Traders were all but certain the RBNZ would raise rates in October, as they held off at the August meeting due to snap lockdowns in New Zealand because of the coronavirus. By the time September 16th rolled around, the market had the rate hike priced in, and then some. Therefore, between September 16th and October 12th, AUD/NZD moved higher. Over the course of that one month, the pair retracement to the 61.8% Fibonacci level from the highs of June 21st to the lows of September 16th, at 1.0609. However, over the last 3 days the pair held the resistance and moved lower, helped on Monday by a surge in Q3 inflation from New Zealand. The result was 2.2% vs an estimate of 1.4% and 1.3% in Q2.
Source: Tradingview, Stone X
Trade AUD/NZD now: Login or Open a new account!
• Open an account in the UK
• Open an account in Australia
• Open an account in Singapore
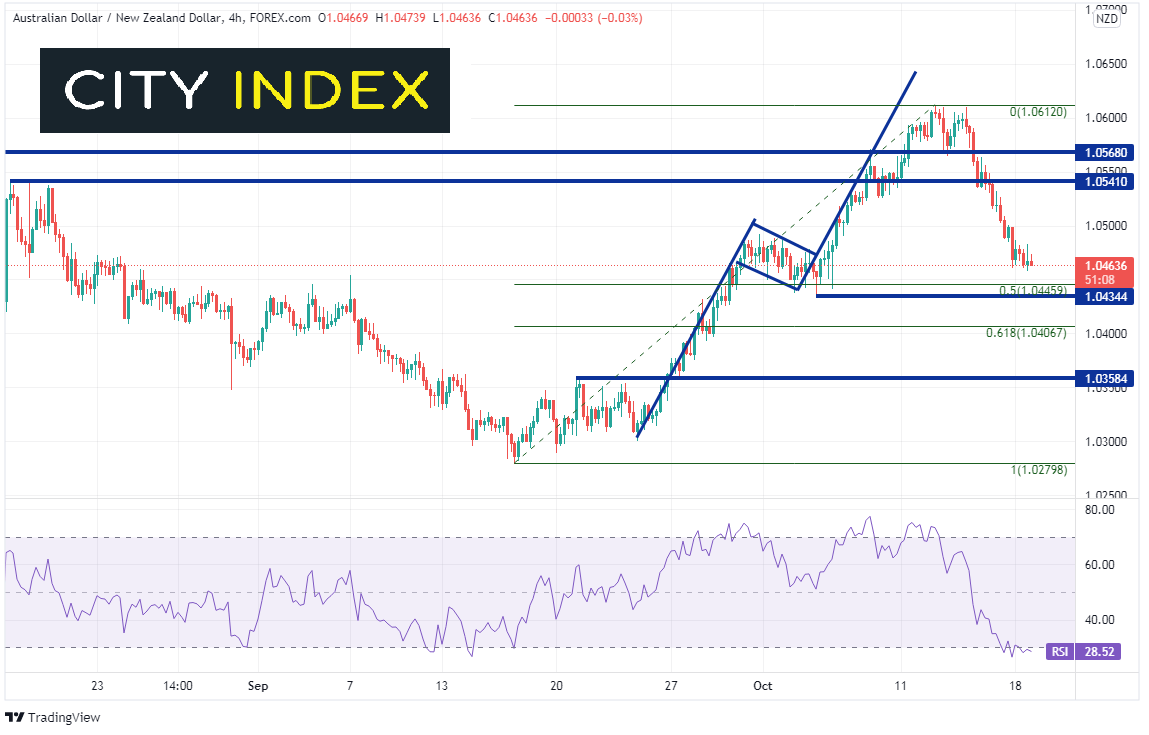
As the RBA minutes approach later today, AUD/NZD halted near 1.0458, just above the 50% retracement level from the September 16th lows and the October 12th highs at 1.0445 and horizontal support at 1.0434. The Reserve Bank of Australia held rates unchanged at their previous meeting but tapered from A$5 billion per week to A$4 billion per week, as promised. However, they said they would leave the pace of buying unchanged until at least mid-February 2022. If the RBA minutes shows that the central bank was more dovish than anticipated, while Q3 CPI from New Zealand was stronger than expected, the selloff could pick-up pace again quickly. Support is at the previously mentioned 1.0445 and 1.0434. Below there is the 61.8% Fibonacci retracement level from the same time period near 1.0407 and then horizontal support at 1.0358. Horizontal resistance above isn’t until 1.0541, and then again at 1.0568.
Source: Tradingview, Stone X
As the last 3 days of trading in AUD/NZD have resulted in a pullback of over 150 pips, the pair may be ready for a short-term bounce. Notice that the RSI is teetering on the edge of oversold levels. However, the bounce doesn’t have to be large for the RSI to move back into neutral territory. With another 25bps hike expected at the November RBNZ meeting, the pair could be back to 1.0280 rather quickly!
Learn more about forex trading opportunities.
Latest market news
Today 11:14 AM
Today 08:28 AM
Yesterday 03:30 PM
Yesterday 01:23 PM
Latest Trade Ideas articles
Today 11:14 AM
Yesterday 11:00 AM
Yesterday 08:15 AM