
USD/JPY 155 in focus around US inflation, BOJ meeting: The Week Ahead
Article
Friday 4:01 PM

The Stochastic oscillator compares the closing price of an instrument to its price over a certain period of time. This can then be used to determine overbought or oversold conditions and forecast possible entry or exit points.
The Stochastic oscillator measures whether an instrument is overbought or oversold by analysing how long it can maintain the trend. This uses two lines: the %K and %D which appear on a sub-chart below the price chart.
The basic calculation called the %K provides the relative position of the closing price within the range of the previous N days.
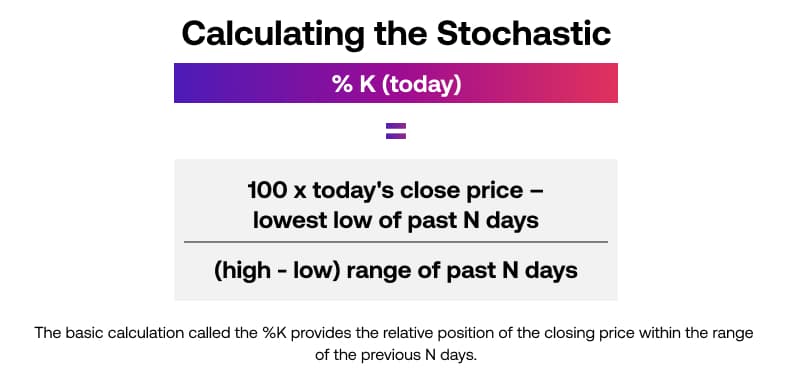
Where range is the highest high of the past N days (not including today) minus the low of the past N days (not including today). Dividing by the range creates a value from 0 – 100.
For example, if we are using the past 10 days (a 10 day Stochastic), the Stochastic would be the current value.
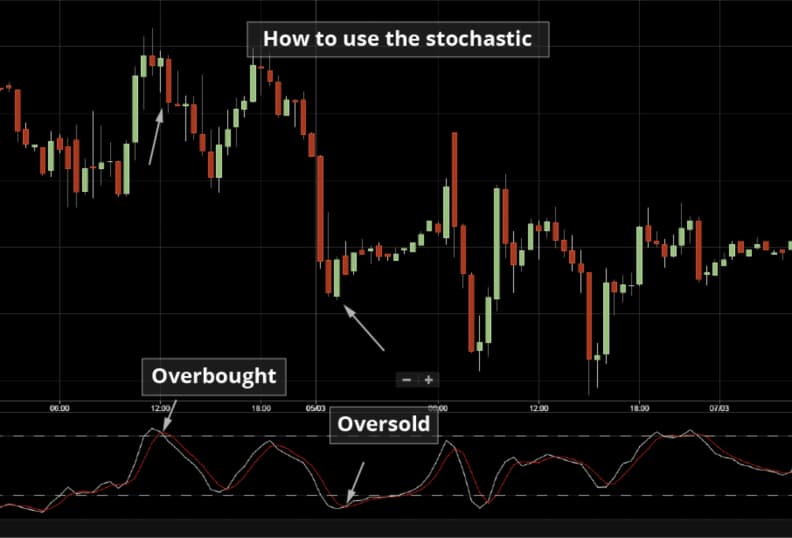
The Stochastic can be used to find overbought or oversold situations or it can also be used when the %K crosses over or below the %D. It can also be used as a tool to find situations where a divergence takes place which is similar to the MACD indicator.
Stochastic readings above 80 – 100 are regarded as a sign of the market being overbought and a reading of 20 and below are considered as the market being oversold. A trader would wait for the indicator to cross from below 0 – 20 and also for the %K to cross above the %D to initiate a Buy signal. If the Stochastic indicator falls below a reading of 80 and also the %K crosses below %D then this could be considered as a Sell signal.
Stochastic can be used on multiple timeframes ranging from minutes, hours, days and weeks. The common time frames are daily for short term traders and weekly for longer term traders. Some traders use the Stochastic on intraday timeframes charts to capture very short term moves lasting from minutes to hours.
This indicator is useful for traders who are looking to time the market for short term reversals and take advantage of overbought or oversold conditions. Remember, this is not guaranteed and markets can be affected by a variety of factors.