
S&P 500 Forecast: SPX steady with Middle East tensions & Netflix in focus
Article
Friday 11:23 PM


Technical and fundamental analysis are two common techniques used by many traders to analyse markets and help them make trading decisions. Fundamental and technical analysis do not need to be viewed as mutually exclusive and many traders combine both when assessing trading opportunities for a more balanced view.
City Index offers a free research portal that provides both technical and fundamental analysis, called Trading Central. The portal can be accessed within the City Index trading platform by clicking on the research tab.
Technical analysts look at historical price data to forecast where price trends may move in the future. They look purely at patterns in charts and ignore the noise of news stories and economic data.
The technical analysis portal constantly scans stocks, FX and commodity markets using a large range of chart patterns, technical indicators and oscillators to identify top buying and selling opportunities.
When you first log in, the overview page displays the top bearish and bullish trading opportunities for the day. By hovering over them you can see more information about which technical indicator has been used to identify the trading opportunity and whether it is over the short, intermediate or longer term.
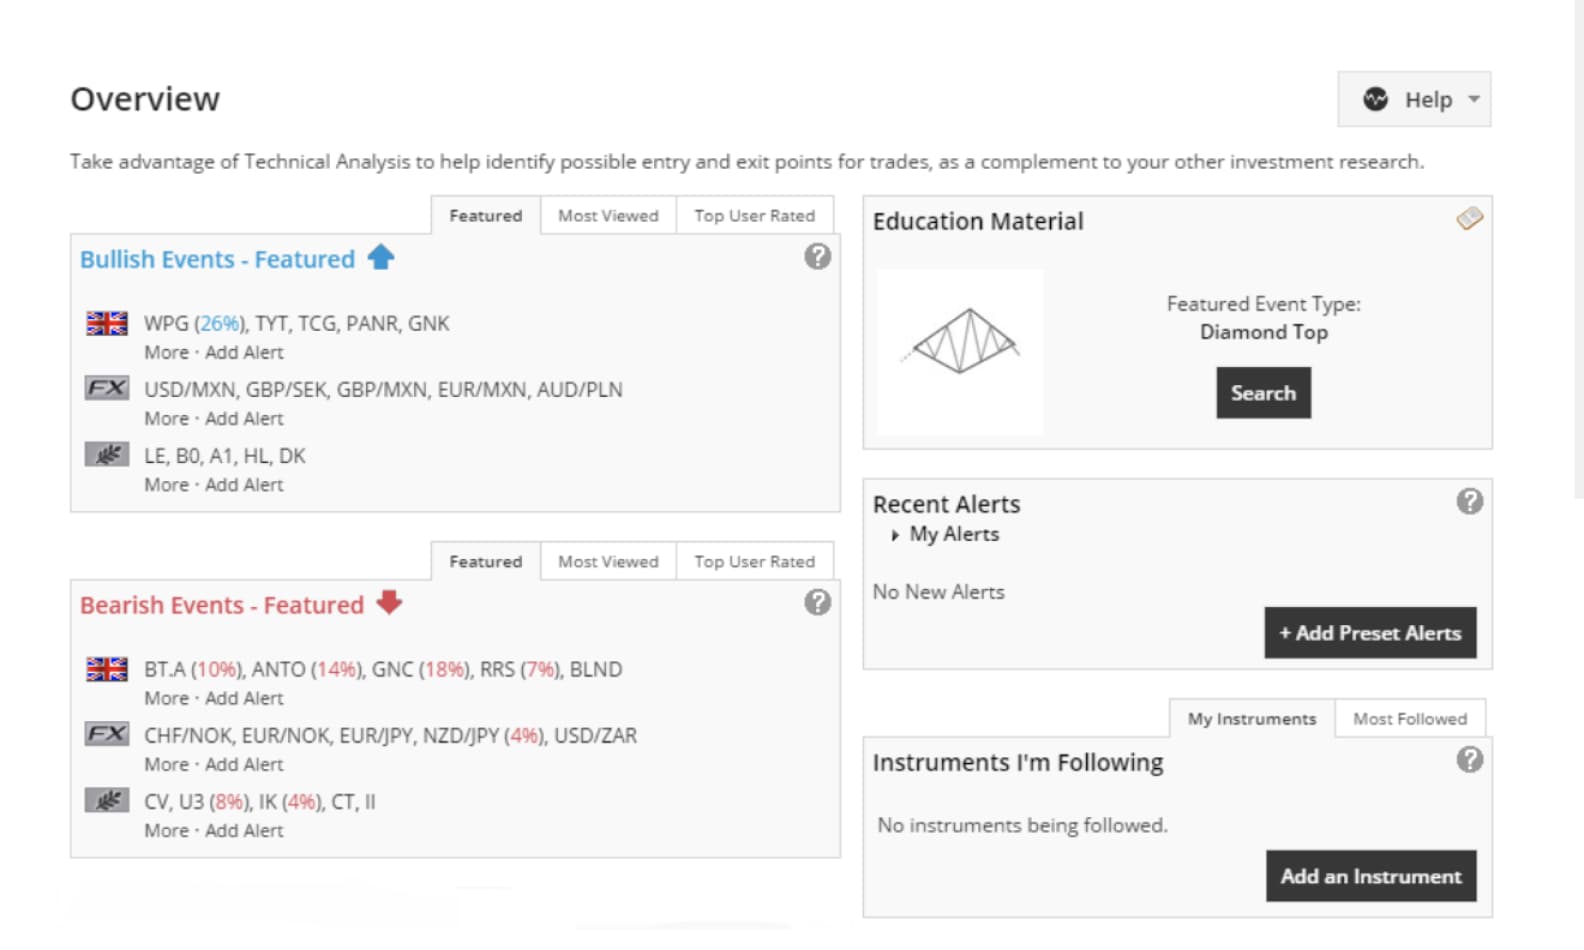
The thumbnail view is ideal for those interested in seeing the chart patterns, and the detailed view provides the best of both worlds by combining the chart with detailed information about the trade idea.
Another way to identify trading opportunities is to use the technical event screener. This allows users to pick from a number of pre-set searches based on the asset class, timeframe and whether we are looking for buy or sell opportunities.
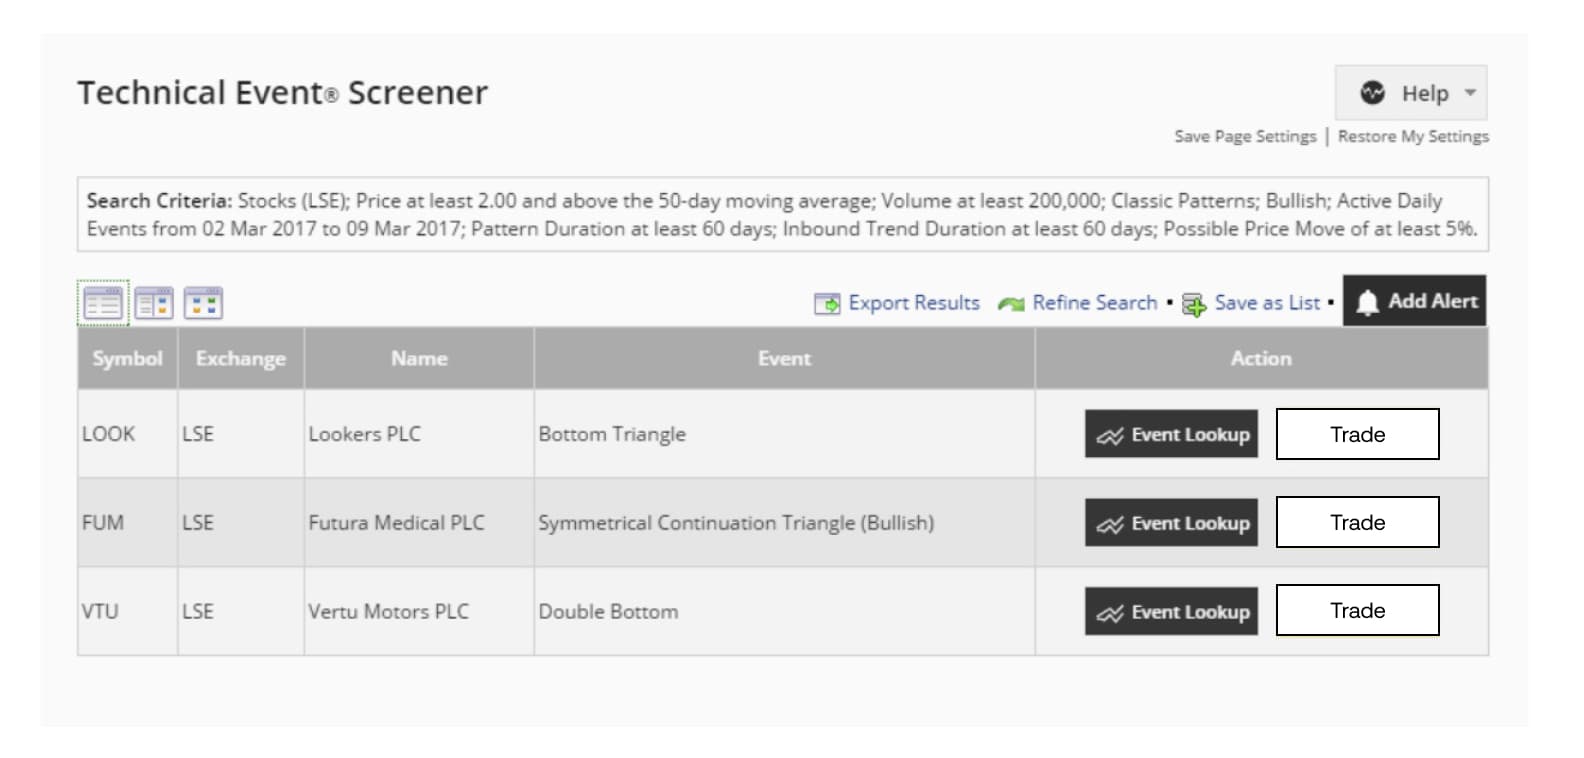
So, for example, pick ‘Stocks with short term bearish outlook’ from the list and it will bring up a whole host of opportunities identified from the chart patterns.
By clicking on the stock it will bring up more information about which indicators have identified it as a bearish opportunity.
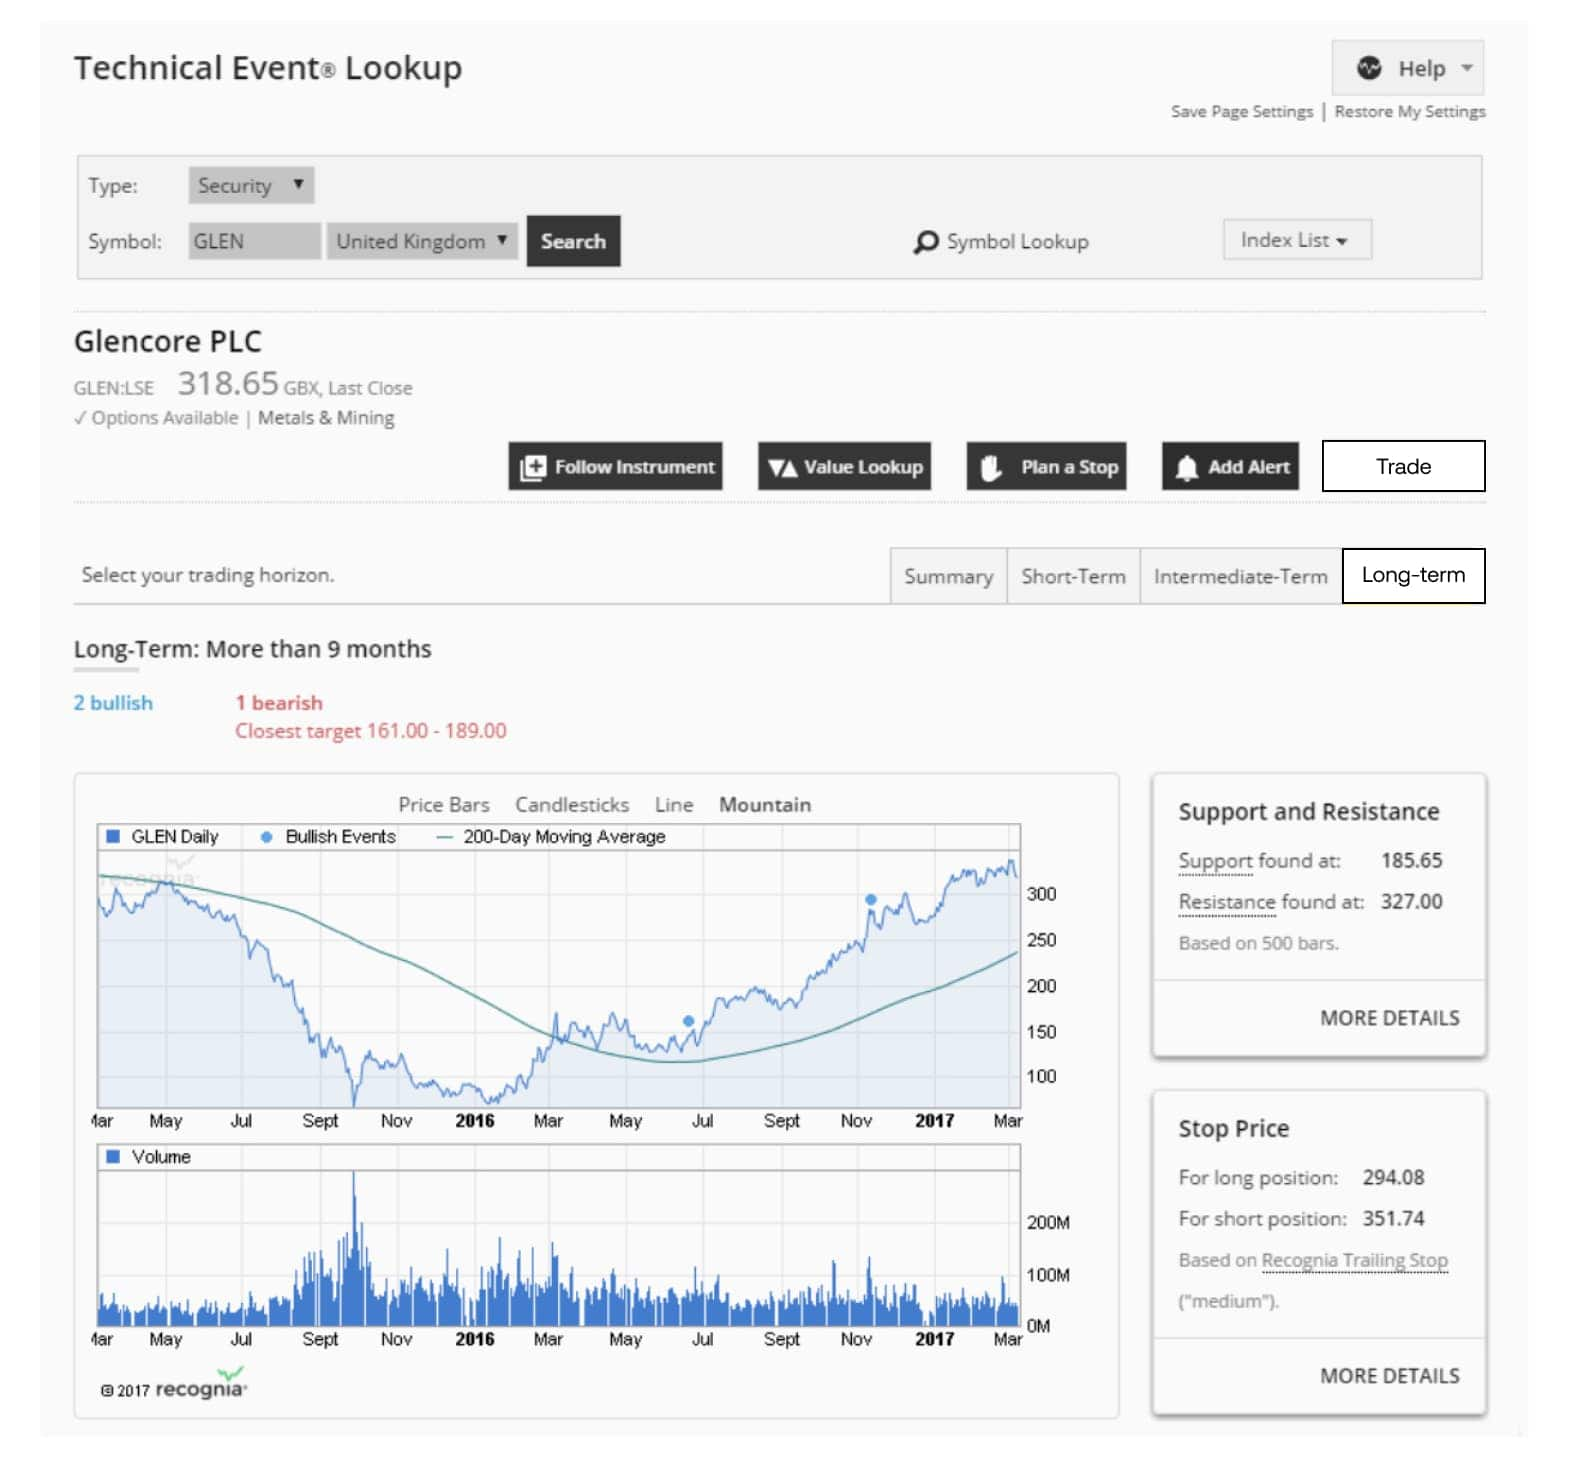
If you are interested in a particular asset, we can use the technical event lookup to search for a particular instrument.
For example, if you are interested in the mining company Glencore, you can search for it in the search box.
The chart shows a 2 year price history of Glencore’s share price. Blue dots indicate when there has been a bullish technical event and red squares indicate a bearish one.
The table underneath indicates what these are, with the newest at the top. Clicking on it gives you more information about that event and what it means.
You can automate a lot of the technical analysis by setting up alerts which will then send you an email when trading opportunities that fit your criteria are identified so that you don’t have to login everyday.
Fundamental analysts, look for the core underlying factors that affect the demand for an asset.
For example, they will concern themselves with complex inter-relationships of financial statements, earnings, growth and other data to make a judgement on whether an asset is under or over-valued, often relative to its sector or its peers.
If you are more interested in trading stocks based on their fundamental data, you should use the fundamental analysis research tool. You can get to this through the research tab in the platform, or by clicking ‘value analyser’ if you are already in the technical analysis portal.
This tool analyses the data of thousands of shares and tells you whether they are under or overvalued and what their projected rate of return is.
This is clearly displayed using the traffic light indicator; green for undervalued, amber for fair-valued and red for overvalued.
For example, if you are interested in a consumer stock such as Domino’s Pizza you can bring up the fundamental details of this stock by searching for it in the value lookup.
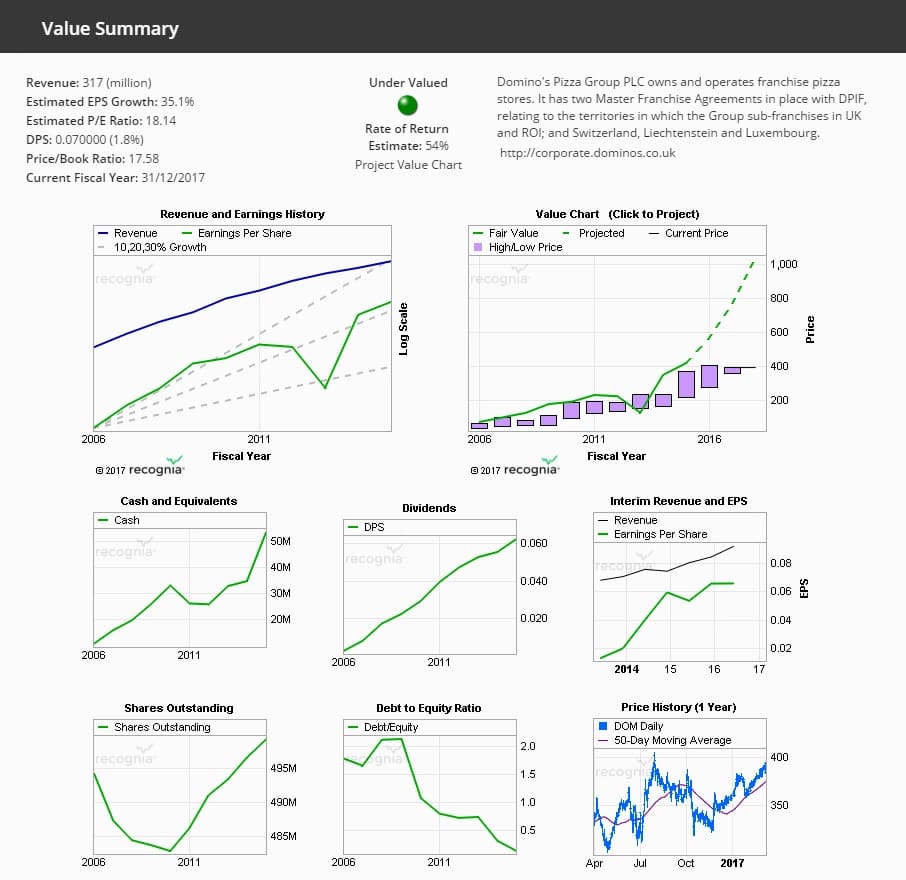
The stock’s valuation is calculated based on what the company stock price is relative to its fair value.
A stock is deemed fairly valued when its price-to-earnings ratio equals its historical earnings-per-share growth rate, also known as EPS.
In the value chart, the purple candles show one year price values, with the high and low of the stock price in a given year.
The green line shows what the Trading Central portal has calculated as the fair value and the black line represents the current price of the stock, which you should then compare to the projected fair value.
Undervalued stocks are where the current price is below the fair value line. When a stock is near fair value, or above the line, it is deemed overvalued and it may not be the best time to invest, even if it is a strong company.
If you think the assumptions are a bit aggressive you can do a ‘what if’ analysis by clicking on the chart which will show you the assumptions that have gone into calculating the fair value.
The default earning per share growth rate is based on what the company has been able to achieve in the past.
If you think the company will not be able to achieve this then you can revise the estimate up or down.
Another way to easily spot trading opportunities across everything on offer is by clicking on feature value stocks on the top tab.
This shows a list of current stocks that are under-valued, organised by region and sector.
The research portal is helpful if you are looking for trade inspiration or embarking on some more detailed analysis on a particular asset that you are interested in trading.
It’s worth noting that many traders use fundamental and technical analysis tools in combination to help build a solid trading plan.