


When will Walmart release Q2 earnings?
Walmart will release second quarter earnings before US markets open on Tuesday August 16.
Walmart Q2 earnings consensus
Walmart provided updated guidance for the second quarter late last month. Below is a table showing the results it reported a year ago, the guidance of how much each measure will rise or fall, and the implied figure that should be looked out for:
|
(Billions, except EPS) |
Q2 2021 |
Outlook |
Q2 2022E |
|
Net Sales |
$139.8 |
+7.5% |
$150.3 |
|
Operating Income |
$7.5 |
-13% to -14% |
$6.48 to $6.55 |
|
Adjusted EPS |
$1.78 |
-8% to -9% |
$1.62 to $1.63 |
Walmart Q2 earnings preview
Walmart sent shockwaves through the retail sector last month when it issued a profit warning. The company, treated as a bellwether for the US economy, warned operating profit will slump as much as 13% in 2022, having previously forecast a mild 1% decline.
That has reduced the potential for any surprises this week. The decline in its share price since the update means the weaker outlook has already been priced in, although visibility is clearly limited considering it has tweaked its outlook three times already this year. It’s not just Walmart feeling the heat, with its smaller rival Target having issued two profit warnings this year as it grapples with similar problems.
Walmart’s sales are still growing, but consumer habits are changing amid the cost-of-living crisis fuelled by rampant inflation that sits at its highest level in over 40 years. Customers are having to spend more of their pay cheque on food and essentials, which is encouraging them to pullback spending on discretionary items. Walmart is known for its low prices and caters more to lower-income consumers, which are the ones grappling the most with soaring prices and bills.
The latest numbers out of the US today showed inflation deaccelerated in July more than anticipated thanks to lower energy and fuel prices, with CPI rising 8.5% from last year compared to the 9.1% rise in June. That was better than expected but does little to allay the pain being felt by consumers. Notably, food costs were up 10.9% from last year, demonstrating how much more money consumers are having to spend on essentials. The latest data suggests inflation has peaked, but prices are still rising and there is no relief in sight for consumers at present. While Walmart will undoubtedly feel the impact as we progress through 2022, it is among the best positioned to keep prices down for cost-conscious consumers and gain market share over smaller rivals that don’t boast the same scale.
Right now, the impact is being felt in terms of profitability. Products such as food typically offer lower margins than larger big-ticket items. Plus, the lacklustre demand means Walmart is saddled with excess inventory and being forced to discount the price of its goods in the hopes of shifting it, which is also contributing to tighter margins.
That prompted Walmart to lower its expectations last month. Below is a table outlining the latest guidance for the current financial year compared to the previous outlook issued in May.
|
(FY2023 YoY % change) |
May 17 |
July 25 |
|
Net Sales |
4% |
4.5% |
|
Operating Income |
-1% |
-11% to -13% |
|
Adjusted EPS (Exc Divestures) |
0% |
-10% to -12% |
One potential area for surprise is Walmart’s growing subscription business, Walmart+, after media reports suggested the retail kingpin is holding discussions with numerous video streaming giants including Paramount, Comcast and Disney about bundling their services into its membership programme. Walmart+ is a monthly subscription costing $12.95 and underpinned by free delivery and discounts, but an addition of a video streaming platform would step up rivalry versus Amazon Prime. Notably, Walmart+ users already get six-months access to Spotify.
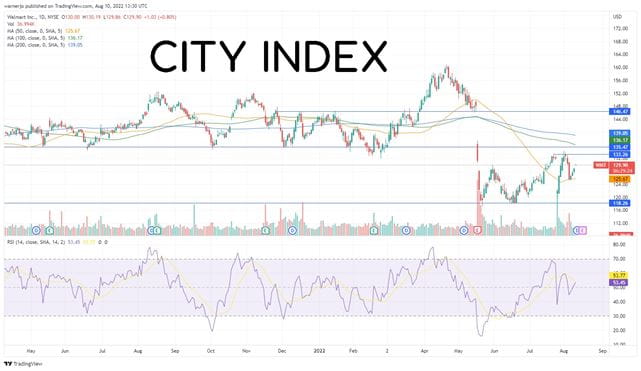
Where next for WMT stock?
Walmart shares have become more volatile since its last set of results back in May. Having closed as low as $118.3, marking its lowest level in over two years, the stock has risen to as high as $133 before losing some steam. The fact trading volumes have increased over the past 20 sessions (compared to the 30-day and 100-day averages) suggests the stock could continue to experience higher than usual volatility going forward.
The $118.3 floor also emerged as a level of support back in June 2020 and the final quarter of 2019, suggesting it should hold. That is reinforced by the fact the RSI was on the cusp of entering oversold territory when it last flirted with this level. Walmart could fall below $115 should it fail. The 50-day moving average at $125 can be treated as an initial floor in the meantime.
The $133 ceiling has been unsuccessfully tested three times during the last three weeks, which could mean this too might be a tough level to crack. Notably, this is where shares sat before the latest profit warning, suggesting it may struggle to surpass this without a new catalyst. A break above here will allow the $135.70 level of support that largely held throughout 2021 and early 2022 come back into play. This is also in-line with the 100-day moving average. A move above here could be more significant as it could allow shares to target the $146 needed to close the gap created when it issued its last set of disappointing results in May. That is close to the $142 average target price set by the 41 brokers that cover the stock.
How to trade Walmart stock
You can trade Walmart shares with City Index in just four easy steps:
- Open a City Index account, or log-in if you’re already a customer.
- Search for ‘Walmart’ in our award-winning platform
- Choose your position and size, and your stop and limit levels
- Place the trade
Or you can try out your trading strategy risk-free by signing up for our Demo Trading Account.
Latest market news
Yesterday 08:33 AM
Latest Equities articles
April 12, 2024 02:28 AM
April 7, 2024 08:46 PM
March 31, 2024 11:22 AM
