
 The Nasdaq posted a strong rally from 13,000 and has risen 10% from its low. It will need to break above 15,625 to confirm a technical bull market (+20% gain from its low) and that remains to be seen. But over the near-term we remain bullish o US indices due to strong bullish momentum and increasing trading volumes, after an extended sell-off. As the Dow Jones saw the weakest retracement from its record high, we prefer long setup son the Dow Jones over the near-term.
 Read our guide on the Nikkei 225 trading guide


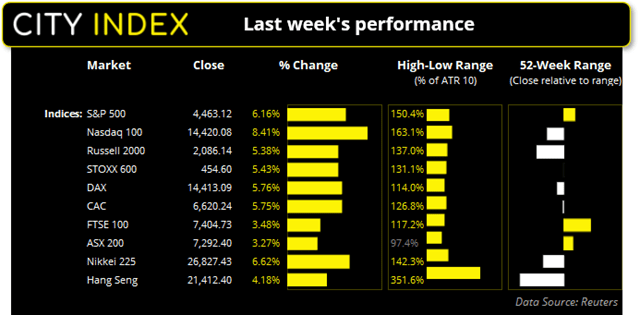
We saw quite a reversal of fortunes on Wall Street last week. In last week’s report we noted that US indices were on track for a third bearish month – which would be its first occurrence since March 2020. Yet a strong rebound for equities now sees the Nasdaq 100, S&P 500 and Dow Jones trading slightly higher for the month. With that said, we still have nearly 2-weeks of trade left in the month but it does at least highlight the higher levels of volatility seen these past few weeks.
The Nasdaq posted a strong rally from 13,000 and has risen 10% from its low. It will need to break above 15,625 to confirm a technical bull market (+20% gain from its low) and that remains to be seen. But over the near-term we remain bullish o US indices due to strong bullish momentum and increasing trading volumes, after an extended sell-off. As the Dow Jones saw the weakest retracement from its record high, we prefer long setup son the Dow Jones over the near-term.
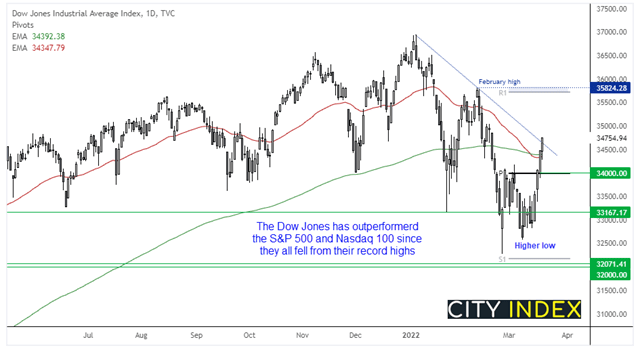
Dow Jones Industrial Average:
The Dow Jones (DJI) has rallied 7.7% from its February low, and printed a higher low in March. The index has closed back above its 200 and 50-day eMA’s and is the only mega-cap index of the three to do so. The monthly pivot sits near the round number of 34,000 so our bias remains bullish above that level over the near-term. We would be interested in dips above this level with an initial target set for 356,000, just below the monthly R1 pivot and February high.
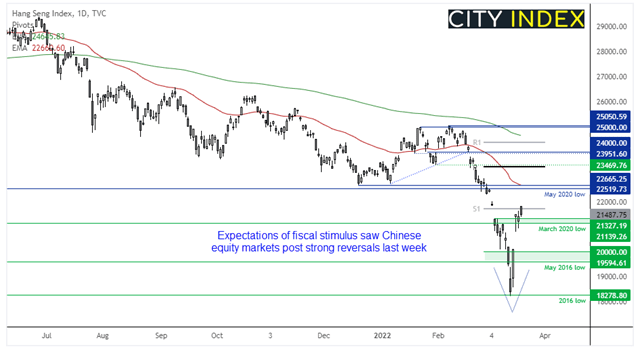
Hang Seng:
No sooner than we saw prices drop and hit our 18,300 downside target, momentum reversed and marked an important swing low. Promise of further stimulus in China sent local markets sharply higher on Wednesday, then proceeded to track Wall Street for the remainder of the week. And with the reversal being so strong it has left a potential V-bottom pattern, which can sometimes be associated with significant market lows. We now look for the March 2020 low to hold as support and prices head for 22,600, near the May 2020 low.
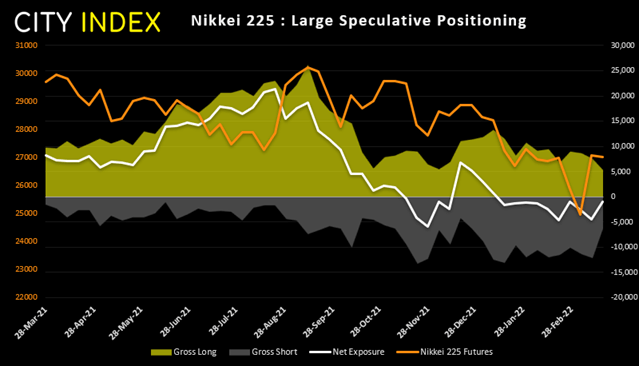
Nikkei futures positioning (priced in yen):
Traders remained net-short Nikkei futures for a tenth consecutive week. Yet their level of bearishness has been reduced to its lowest point since flipping to net-short exposure back in January. 5.8k short contracts were closed, along with -2.3k long contracts which saw net-short exposure reduced by -3.6k contracts.
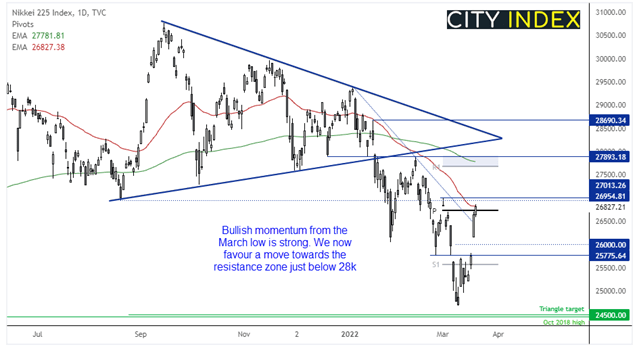
Nikkei 225 index:
We warned in last week’s report that the Nikkei showed the potential for a countertrend bounce, and that is exactly what we saw with the index rallying 6.6% by Friday’s close. Futures markets have since risen to a 3-week high as sentiment remains positive at the start of the week.
A key level for bulls to conquer (and defend as support) is 27,000, as this would also see the Nikkei trade comfortably above the 50-day eMA. Whilst prices remain above 27,000 we favour a move to the 27,893 high, which is near the 200-day eMA and monthly R1 pivot.
Read our guide on the Nikkei 225 trading guide
How to trade with City Index
You can easily trade with City Index by using these four easy steps:
-
Open an account, or log in if you’re already a customer
• Open an account in the UK
• Open an account in Australia
• Open an account in Singapore
- Search for the company you want to trade in our award-winning platform
- Choose your position and size, and your stop and limit levels
- Place the trade
Latest market news
Yesterday 08:33 AM
Latest Hong Kong 50 articles
October 26, 2022 12:38 AM
October 26, 2022 12:38 AM
September 6, 2022 12:21 AM
July 26, 2022 09:33 AM