


January 12, 2022 3:49 AM
USD/CAD is close to a key level of 1.2600, which if broken, could set the stage for the direction of the pair for the near-term future.
Like many other currencies, inflation and jobs are the 2 biggest factors in determining the exchange rate.
- The US inflation now stands at 6.8% YoY. Tomorrow, the US releases December’s CPI, which is expected to be 7%
- Canadian inflation now stands at 4.7% YoY, its highest reading since February 2003.December’s inflation report will be released next week
- US Non-Farm Payrolls have disappointed the last 2 months, with readings of 249,000 and 199,000. Bothe were much weaker than expected
- Canada’s Employment Change over the last 2 months was +153,700 and +54,700.Both were stronger than expected
Trade USD/CAD now: Login or Open a new account!
• Open an account in the UK
• Open an account in Australia
• Open an account in Singapore
Canada has already ended its bond buying program, and some are looking for the Bank of Canada to begin hiking rates at soon as its next meeting on January 26th, having kept rates unchanged at 0.25% at its previous meeting. In the US, Fed Chairman Powell has indicated that the Fed’s bond buying program will end in March. Markets are also pricing in a rate hike at the March meeting, and 3 more for the rest of 2022.
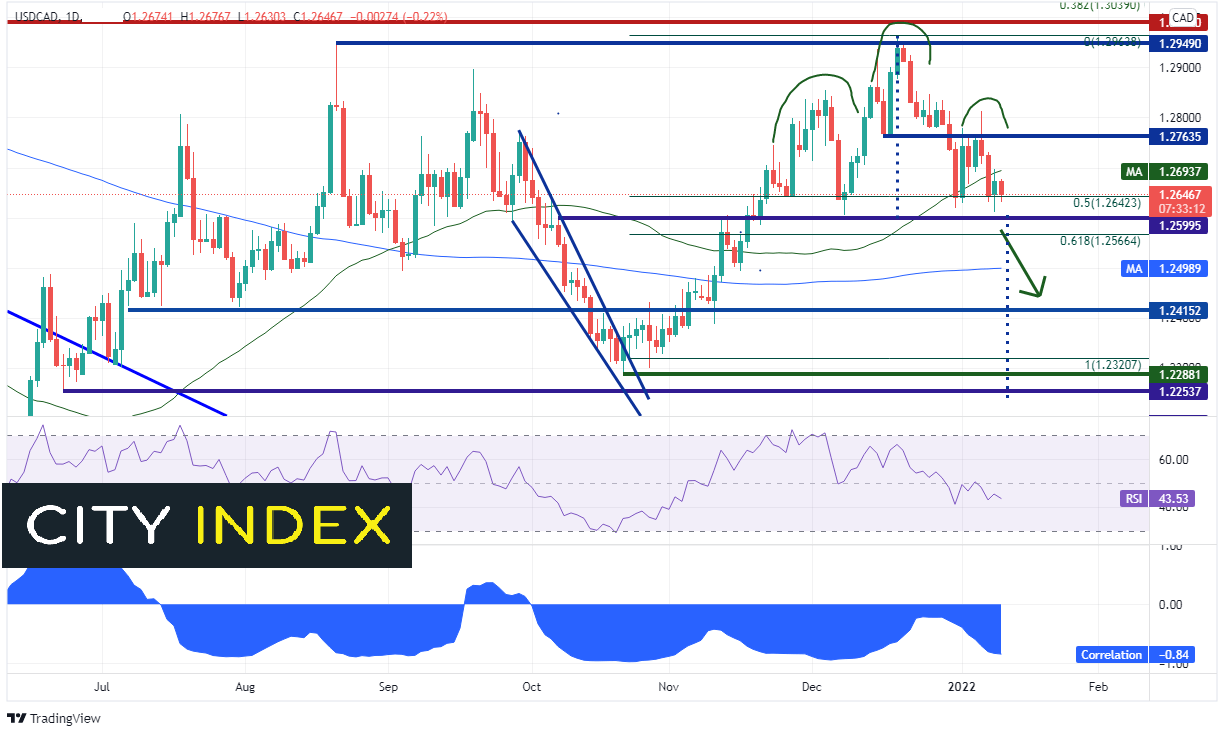
USD/CAD is approaching the neckline of a head and shoulders pattern.
.Big head and shoulders formation in #USDCAD! Break of 1.2600 targets previous lows near 1.2250/1.2300
— Joe Perry FOREX.com (@JoeP_FOREXcom) January 11, 2022
Keep an eye on #Oil . Strong negative #correlation at -0.84!
If price breaks below the neckline of the pattern at 1.2600, the target is near 1.2240. However, the pair will first have to pass through support at the 61.8% Fibonacci retracement level from the October 21st, 2021 low to the December 20th, 2021 highs at 1.2566, the 200 Day Moving Average at 1.2500 and horizontal support at 1.2415. If 1.2600 holds, resistance is at the 50 Day Moving Average at 1.2693, horizontal support at 1.2764 and the December 20th, 2021 highs at 1.2950.
Source: Tradingview, Stone X
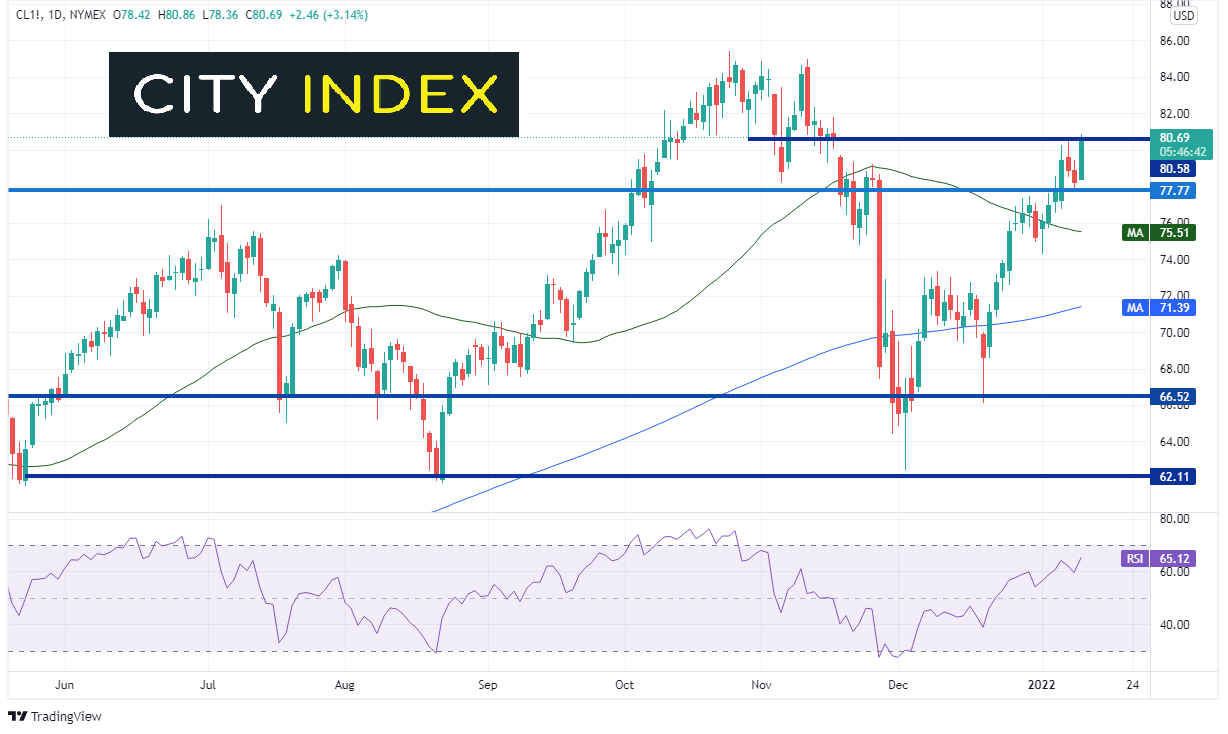
Another factor that is important to pay attention to when watching USD/CAD is Crude oil. Notice at the bottom of the chart below that the two assets are highly negatively correlated at -0.84. Any reading above +0.80 or below -0.80 is considered a “significant” correlation. Therefore, if Crude oil continues to move higher, it should cause USD/CAD to move lower.
For reference, WTI Crude Futures are currently trading at resistance at $80.58 as of the time for this writing.
Source: Tradingview, Stone X
Watch for an aggressive break in USD/CAD through 1.2600. If stops are triggered, the pair could be at the next support level in a hurry. US CPI and Crude Oil could be factors to help move the pair soon.
Learn more about forex trading opportunities.
Latest market news
Today 08:18 AM
Yesterday 10:40 PM
Latest USD/CAD articles
April 16, 2024 04:24 AM
November 21, 2023 12:00 PM
November 10, 2023 04:00 PM
October 27, 2023 01:33 PM