


January 4, 2023 7:39 AM
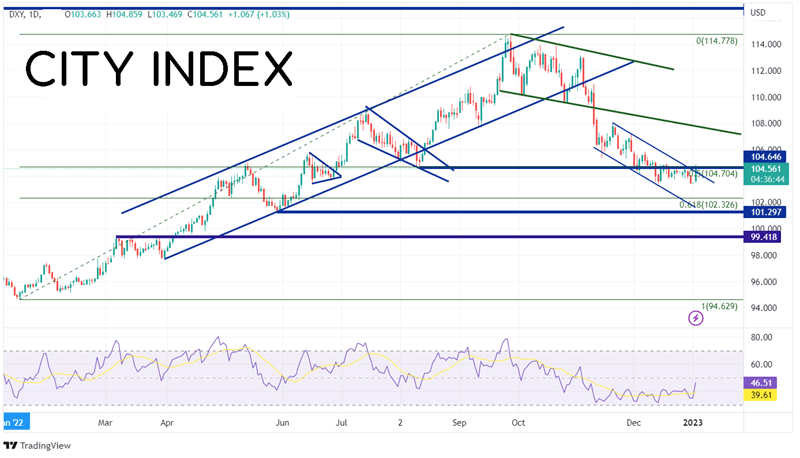
The US Dollar Index is off to a great start for the year, up 1% near 104.50. The DXY rose for a good part of 2022, moving from 94.63 on January 14th to 114.78 on September 28th! However, in the 4th Quarter, the index pulled back just over 50% of that move, settling at 103.49 for the year. On November 10th, CPI came out much weaker than expected. As such, the DXY fell from 110.30 down to 106.28 by the end of November 11th. From there, the index formed a downward sloping channel to the end of the year. Today, on the first trading day of 2023, the DXY broke higher above the downward sloping trendline of the channel and back above the previously mentioned 50% retracement level of 104.70. Will the US Dollar continue to move higher into 2023?
Source: Tradingview, Stone X
Trade the DXY now: Login or Open a new account!
• Open an account in the UK
• Open an account in Australia
• Open an account in Singapore
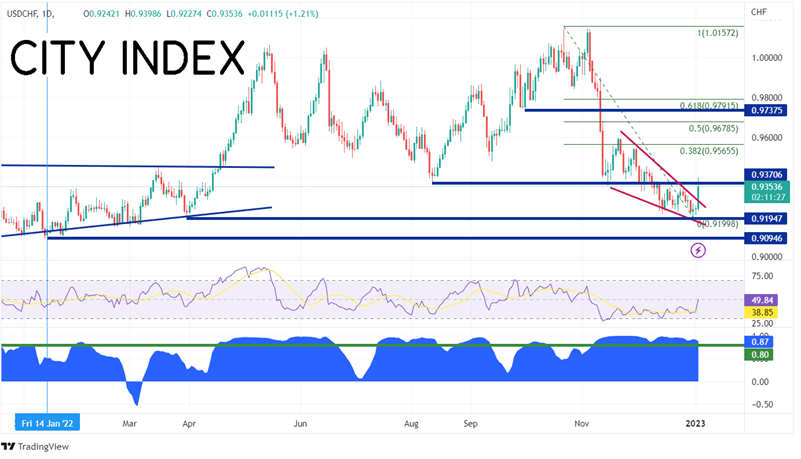
The chart below is USD/CHF. Notice the correlation coefficient at the bottom of the chart. The current correlation coefficient between the 2 assets is +0.87. Correlations with a reading above +0.80 are considered strong positive correlations, that is, the 2 assets move in the same direction a majority of the time. USD/CHF also made a low for 2022 on January 14th at 0.9227. The pair made its 2022 high on October 21st, at 1.0158. But it wasn’t until November 7th that the correlation reestablished itself above +0.80 and took it to the end of the year.
Source: Tradingview, Stone X
Trade USD/CHF now: Login or Open a new account!
• Open an account in the UK
• Open an account in Australia
• Open an account in Singapore
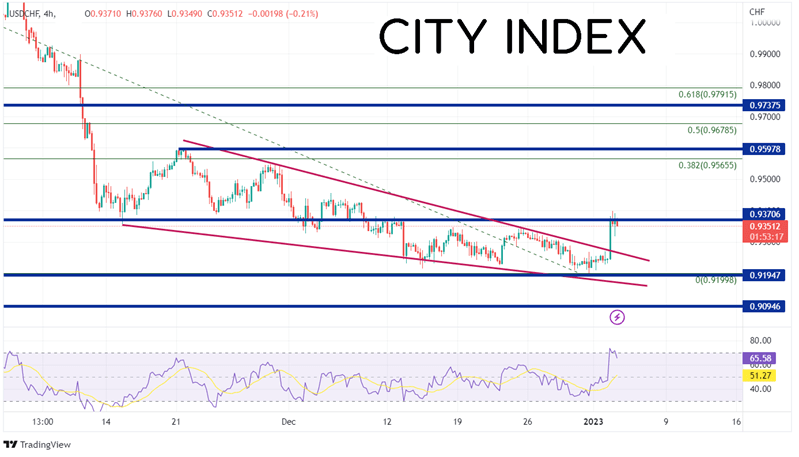
On a 240-minute timeframe, as the DXY formed a downward sloping channel into the end of the year, USD/CHF was forming a descending wedge. Just as the DXY broke above the top trendline of the channel today, USD/CHF moved above the top trendline of the descending wedge. The target for the breakout of a descending wedge is a 100% retracement, or near 0.9598. As long as the correlation remains above +0.80, if the US Dollar Index moves higher, so too should USD/CHF. The first resistance for USD/CHF is the 38.2% Fibonacci retracement level from the highs of October 21st to the lows of December 30th at 0.9566. Above there, resistance is at the target of the descending wedge and then the 50% retracement of the previously mentioned timeframe at 0.9679. However, if the move in the DXY is faded, USD/CHF may pull back and resume its trend lower. First support is at the top trendline of the channel near 0.9270, then the December 30th low at 0.9200. Below there, the bottom trendline of the narrowing wedge comes into play near 0.9170.
Source: Tradingview, Stone X
The US Dollar Index (DXY) was shot out of a cannon on the 1st trading day of 2023. As a result of its strong correlation with USD/CHF, the DXY brought the pair higher with it. Will the DXY continue to move higher? If it does, as long as the strong correlation holds, USD/CHF should move higher as well.
Learn more about forex trading opportunities.
Latest market news
Today 01:15 PM
Today 11:30 AM
Today 08:18 AM