


June 2, 2022 5:04 AM
The ISM Manufacturing PMI for May in the US was 56.1 vs 54.5 expected and an April reading of 55.4. Better data was seen in the production, new orders, and inventory components. Although price pressures eased slightly, supply chain issues and pricing were still the main issues that worried businesses. Overall, the beginning of month ISM data was stronger than expected. Good news in the economic data gives the Fed more confidence to raise rates, and therefore, sends the US Dollar higher.
In addition, the Fed hawks were out in force today. First up was former NY Fed President William Dudley who penned a Bloomberg Op-ed piece and said that “the Fed needs to tighten financial conditions, and the only way to do that is to hike interest rates by a substantial amount”. In addition, the Fed’s Waller said that he supports tightening policy by another 50bps for several meetings. He also said that “I am not taking 50bps hikes off the table until I see inflation coming down closer to our 2% target”. Finally, it was the ultra-hawkish Bullard who was on the wires later in the day. He noted that the current US macro situation is straining the Fed’s credibility on inflation and that inflation expectations could become unmoored without Fed action. Finally, Bullard said that 3.5% for Fed Funds rate is a good minimum for how high policy rates need to go. These comments all suggest that today’s Fed speakers are looking for higher rates, and therefore, a higher US Dollar.
Everything you need to know about the Federal Reserve
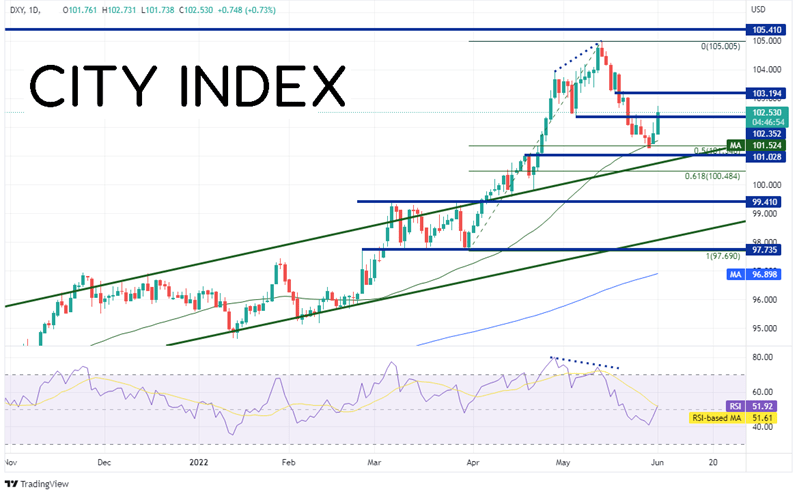
The DXY on a daily timeframe broke above an upward sloping channel on April 6th and hasn’t traded below it since. Price rallied into a near 20-year high at 105.00 on May 13th as the RSI was in overbought territory and diverging with price. Price then pulled back to a near-term low on May 30th at 101.30, which was also the 50 Day Moving Average and the 50% retracement level from the lows of March 31st to the highs on May 15th. Yesterday, price began moving higher however the DXY exploded higher today, taking out resistance at 102.35.
Source: Tradingview, Stone X
Trade the DXY now: Login or Open a new account!
• Open an account in the UK
• Open an account in Australia
• Open an account in Singapore
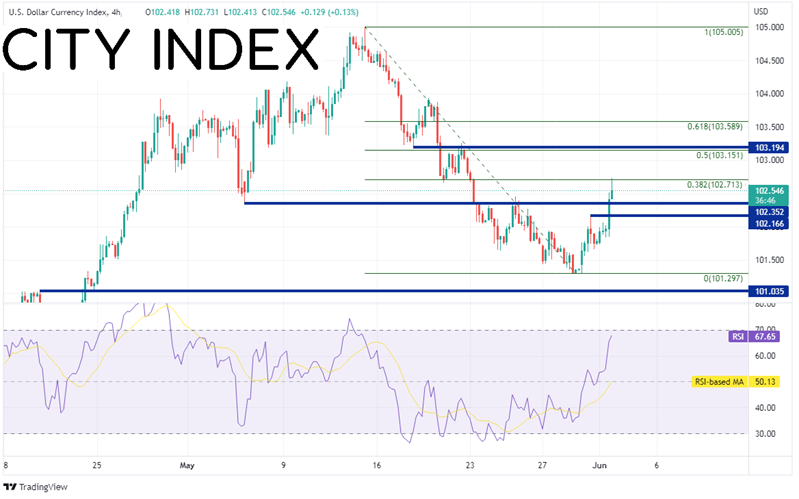
On a 240-minute timeframe, the DXY was halted at resistance near the 38.2% Fibonacci retracement level from the high of May 13th to the low on May 30th at 102.72. Next resistance is 103.15/19, which is a confluence of horizontal resistance and the 50% retracement from the same timeframe. Above there, price can run to the 61.8% Fibonacci retracement level at 103.59. First support is at the previous resistance level of 102.58. Below there, price can fall to the May 31st highs at 102.17, then the May 30th lows at 101.30.
Source: Tradingview, Stone X
Today’s US ISM Manufacturing PMI and hawkish Fed speakers were bullish for the US Dollar. Will the DXY continue to move higher? It may depend on Non-Farm Payrolls on Friday. If the print is stronger than expected (+320,000), the Fed may feel emboldened to raise rates at a quicker pace when members gather on June 15th!
Learn more about forex trading opportunities.
Latest market news
Yesterday 08:33 AM
Latest Forex articles
April 17, 2024 02:40 PM
April 17, 2024 04:47 AM
April 16, 2024 12:00 PM
April 16, 2024 04:24 AM