


January 13, 2023 3:32 AM
It seems like the market has been waiting all week for the US December CPI to be released. The headline print was 6.5% YoY vs and expectation of 6.5% YoY and a November reading of 7.1%. Today’s print was the lowest since October 2021 and the sixth straight month the inflation rate has dropped. The Core CPI, which excludes food and energy prices, also fell. The December print was 5.7% YoY vs an expectation of 5.7% YoY and a November reading of 6% YoY. This was the lowest reading in over 1 year.
Although US CPI is moving in the right direction, it is also helpful to look at the MoM print. The December MoM CPI print was -0.1% vs an expectation of 0% and a prior reading of +0.2%. This is the first decline in the MoM print since May 2020! Gasoline costs contributed the most to the MoM decline, however also included were lower prices for used cars and airline fares.
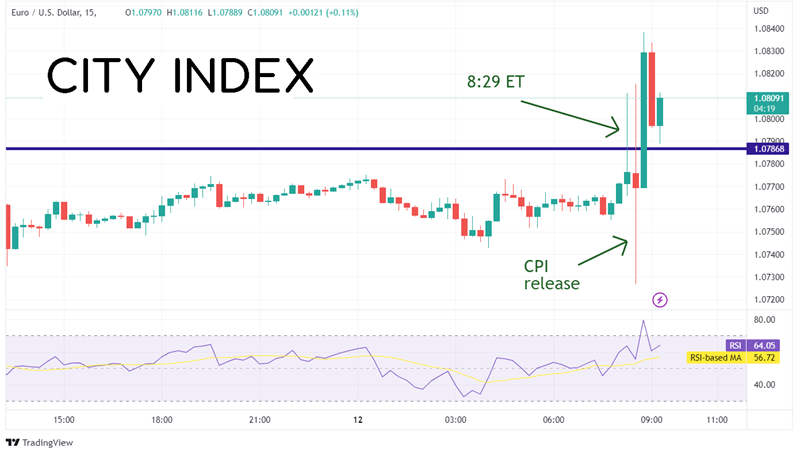
The US Dollar was extremely volatile around the release of the CPI data. 1 minute before the release, EUR/USD spiked higher by 45 pips, as it appeared the data was leaked early. However, once the CPI was released and was “as expected”, EUR/USD traded between 1.0727 and 1.0838 for the next hour. Will EUR/USD continue to move higher?
Source: Tradingview, Stone X
Trade EUR/USD now: Login or Open a new account!
• Open an account in the UK
• Open an account in Australia
• Open an account in Singapore
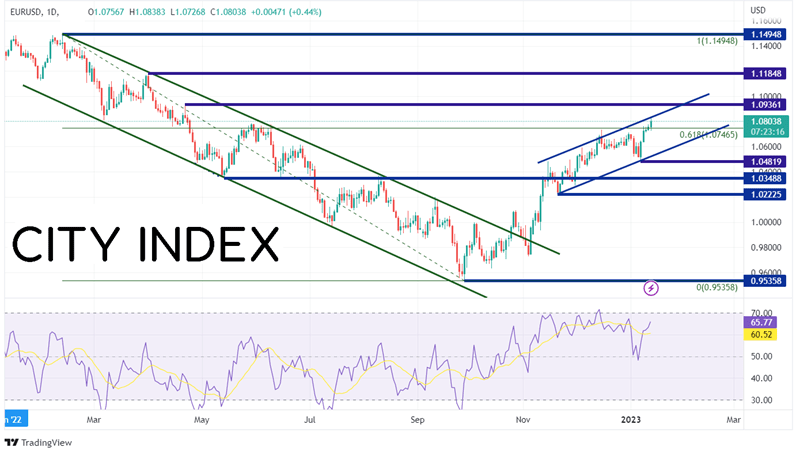
On a daily timeframe, EUR/USD has been moving higher since making a 2022 low on September 28th at 0.9536. Price broke through the top trendline of a channel the pair had been in since February 2022, strong horizontal resistance near 1.0350, and the 200 Day Moving Average. It then began moving in a new upward sloping channel from mid-November 2022 until today. The weaker dollar also sent the pair above the 61.8% Fibonacci retracement level from the high of 2022 to the low of 2022 at 1.0747.
Source: Tradingview, Stone X
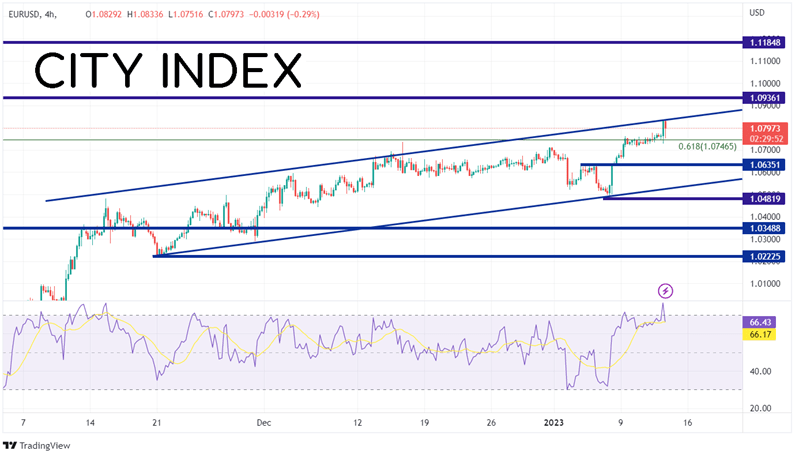
On a 240-minute timeframe, EUR/USD is testing the top trendline of the upward sloping channel near 1.0840. If price continues to move higher, the next resistance level is at the April 21st 2022 high of 1.0936, then the high of March 31st at 1.1185. However, notice that the RSI is in overbought territory. This is an indication that price may be ready for a pullback. If EUR/USD moves lower, the first support is at 1.0635. Below there, price can move to the bottom trendline of the channel near 1.0520, then the lows of January 6th at 1.0482.
Source: Tradingview, Stone X
As the CPI continues to rise at a slower and slower pace, the Fed appears to be ready to slow the pace of interest rate hikes, or even pause. As a result, the US Dollar has been moving lower and EUR/USD has been moving higher. If the data continues to point to a slowing US inflationary environment, EUR/USD should continue to move higher.
Learn more about forex trading opportunities.
Latest market news
Today 01:15 PM
Today 07:49 AM
Today 04:24 AM
Latest Trade Ideas articles

Today 07:49 AM
Today 04:24 AM