


February 17, 2023 3:51 AM
The thought process behind the Producer Price Index is that the costs associated with producers will make their way to the end of the supply chain over the next few months and eventually be reflected in the Consumer Price Index (CPI). The US PPI for January released today was much higher than expected. The headline print was 6% YoY vs an expectation of 5.4% YoY. The December print was also revised higher from 6.2% YoY to 6.5% YoY. However, the print has fallen for the seventh month in a row and is now at its lowest point since March 2021. In addition, the Core PPI for January was 5.4% YoY vs an expectation of only 4.9% YoY and a December reading of 5.5% YoY. This was the lowest level since May 2021. Although inflation is moving in the right direction (lower), PPI missed estimates and is still way above the Fed’s inflation target of 2%. Recall that December CPI was 6.4% YoY, higher than the expected 6.2% YoY.
In addition to PPI, the US also released its Philadelphia Fed Manufacturing Index. The actual print was -24.3 vs an expectation of -7.4. The previous reading was -8.9. The employment and new orders components both fell, however we should note that the Prices Paid component (inflation component) rose to 26.5 vs and estimate of 23 and a December reading of 24.5. Because the Fed has said it is not worried about a recession, the inflation component of the Philly Fed should matter most. Higher prices paid is inflationary.
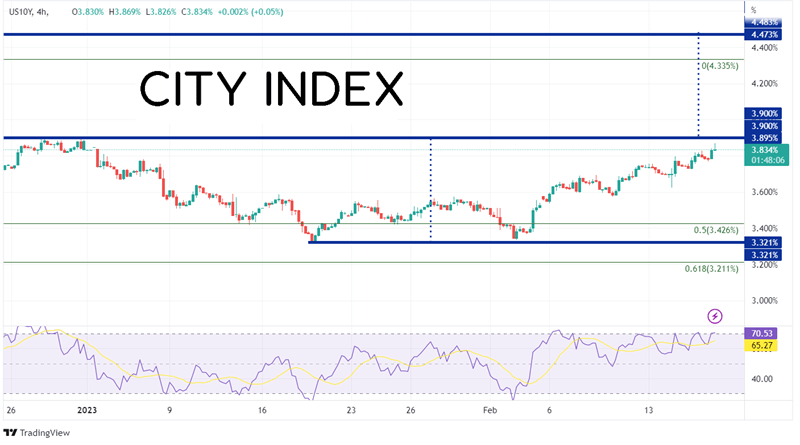
As a result of the higher inflationary data, US 10 year yields are pushing higher. Today, yields have reached an intra-day high of 3.869%, the highest level since December 30th, 2022. If yields break above resistance at 3.905%, they may move a lot higher.
Source: Tradingview, Stone X
Trade US 10 year yields now: Login or Open a new account!
• Open an account in the UK
• Open an account in Australia
• Open an account in Singapore
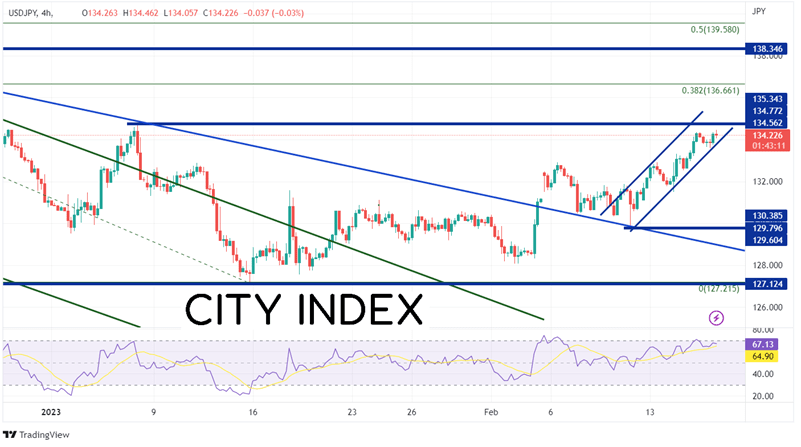
As we discussed is Wednesday’s piece regarding the correlation between US 10 Year Yields and USD/JPY, a higher 10 Year Yield should mean a higher USD/JPY. A break of 134.77 could usher in a new wave of USD/JPY buying as stops are triggered. The first resistance isn’t until 136.66, which is the 38.2% Fibonacci retracement level from the highs of October 21st, 2022 to the lows of January 16th.
Source: Tradingview, Stone X
Trade USD/JPY now: Login or Open a new account!
• Open an account in the UK
• Open an account in Australia
• Open an account in Singapore
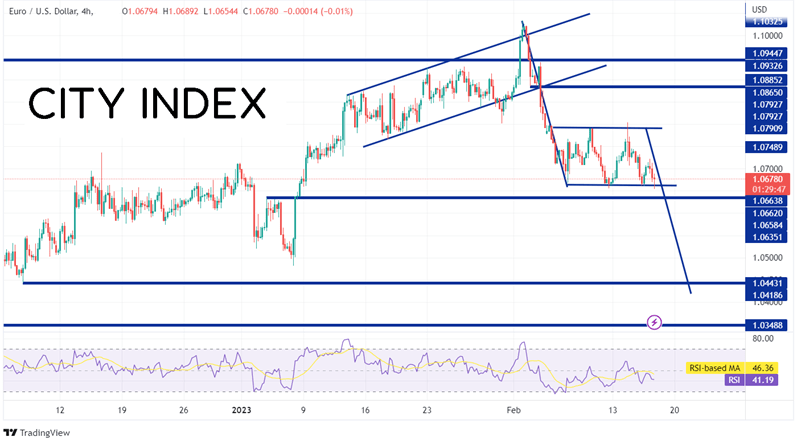
With the US Dollar moving higher, it sets up a scenario where EUR/USD may be ready to break below the flag pattern that the pair has been in since February 6th. Just below the base of the flag is support dating to early January. For confirmation, traders may be waiting for the pair to move below 1.0635 before establishing a short position. The target for a flag pattern is the height of the flagpole added to the breakdown point of the flag. In this case it is near the lows of December 22nd, 2022 at 1.0420.
Source: Tradingview, Stone X
Trade EUR/USD now: Login or Open a new account!
• Open an account in the UK
• Open an account in Australia
• Open an account in Singapore
Along with the stronger than expected CPI print on Tuesday, the PPI and the Prices Paid component of the Philadelphia Fed Manufacturing Index paint a hawkish picture for inflation. Therefore, US rates are moving higher, bringing the USD/JPY along with it. Will the US Dollar strengthen against other pairs as well? If it does, EUR/USD may be ready to break down.
Learn more about forex trading opportunities.