


July 14, 2022 12:05 AM
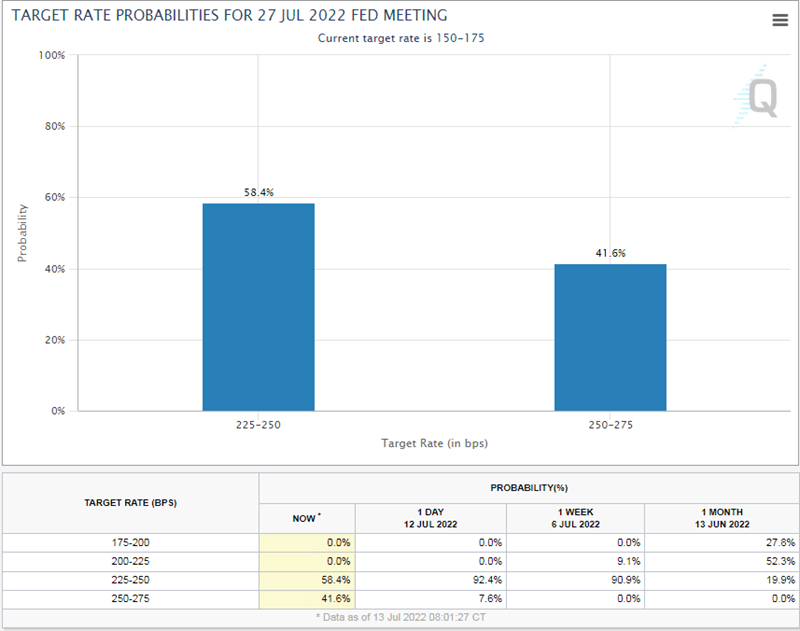
US CPI for June was 9.1% YoY vs 8.8% YoY expected and 8.6% YoY in May. This is the highest reading since November 1981! The Core CPI was 5.9% YoY vs 5.7% YoY expected and 6% YoY in May. Although energy and food prices may make up a large percentage of the overall inflation, prices have gone up in other areas as well, such as shelter, new and used vehicles, and airline fares. This will put pressure on the Fed to hike rates by 75bps at the July meeting on July 26-27. Recall that two days prior to the June FOMC decision, the Fed leaked to the WSJ that it was going to hike 75bps, rather than the expected 50bps, as a result of the higher than expected May CPI reading of 8.6% YoY. Could the large jump in headline inflation cause the Committee to consider a 100bps increase? According to the CME’s Fed Watch tool, markets are currently pricing in over a 40% chance of a 100bps hike at the next meeting!
Source: CME
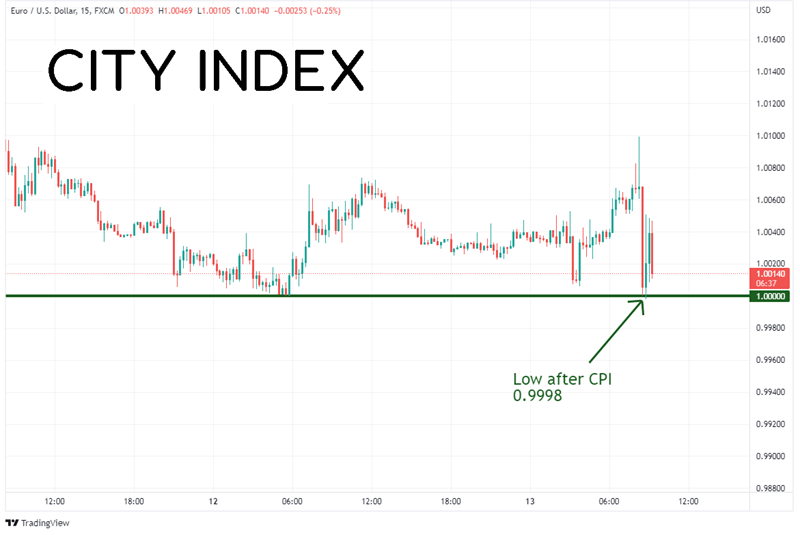
Despite the higher than expected CPI data, EUR/USD is still struggling to make any headway below the all-important psychological round number of 1.0000. The low following the CPI release was 0.9998 before buyers entered and ramped the pair up 50 pips, trying to stop out weak shorts. The pair has come back offered, and it may just be a matter of time before the pair trades aggressively below parity.
Source: Tradingview, Stone X
Trade EUR/USD now: Login or Open a new account!
• Open an account in the UK
• Open an account in Australia
• Open an account in Singapore
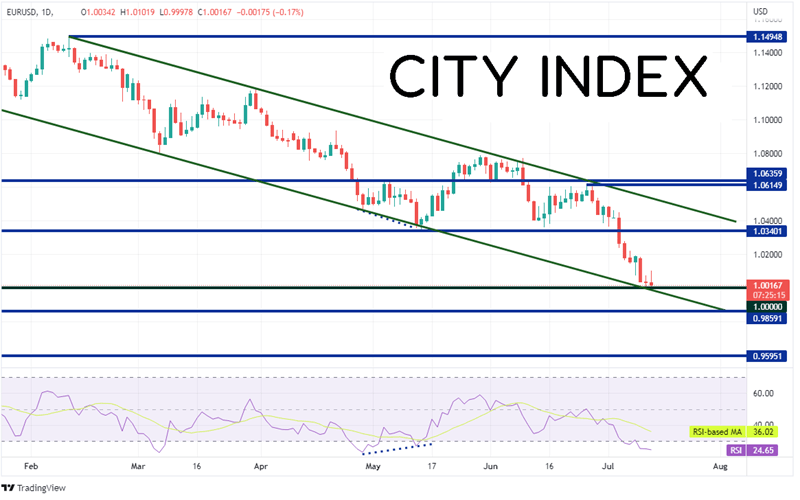
On a longer-term, daily timeframe, EUR/USD is trading at a confluence of support. In addition to the psychological round number of 1.0000, the pair is trading at the bottom trendline of the channel the pair has been in since the beginning of the year (though the pair has been moving lower for over 1 year). If EUR/USD continues to pressure current support, the next support level is the lows of December 2002, near 0.9859 and then the highs of January 2001, at 0.9595. However, notice that the RSI is in oversold territory, indicating the possibility for a bounce. First resistance isn’t until much higher, at a series of prior lows near 1.0340. Above there, price can bounce to the top downward sloping trendline of the channel near 1.0520, then the highs of June 27th at 1.0615.
Source: Tradingview, Stone X
The US CPI print came out much hotter than expected 9.1% YoY. This print, combined with the strong employment data, should give the Fed confidence to hike at least 75bps at the upcoming meeting. Will other inflation readings confirm the CPI print? Markets will be watching the Michigan Inflation Expectations print due out on Friday!
Learn more about forex trading opportunities.
Latest market news
Latest Forex articles

April 17, 2024 02:40 PM
April 17, 2024 04:47 AM
April 16, 2024 12:00 PM