


FTSE rebounds, travel stocks extend gains
The UK index is attempting to pick up after steep falls in the previous session. The UK index declined 0.8% in the previous session, faring better than its European peers such as the Dax which dropped over 2.5% on the back of fears over the wider fallout from China’s Evergrande which is likely to default this week.
Travel stocks offered support to the index after the US announced that it will reopen to air travelers who are fully vaccinated easing pandemic restrictions.
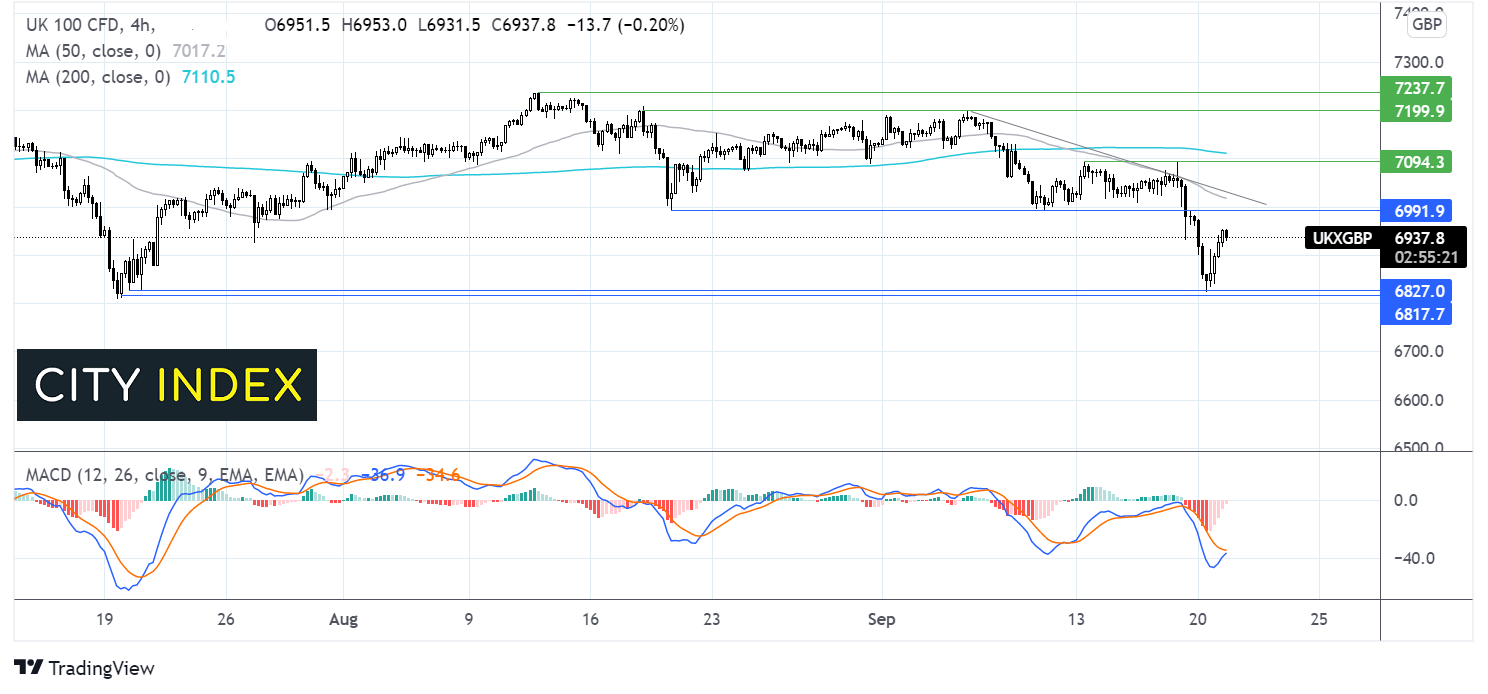
Where next for the FTSE?
After falling steeply in the previous session, the UK index found support at 6825 a two-month low and the 200 sma on the daily chart. The price is rebounding higher on the four-hour chart with a receding bearish bias on the MACD keeping buyer’s hopeful and watchful for a bullish crossover.
A move back over 6990 is needed to negate the near-term downtrend and open the door to the 50 sma and the falling trendline at 7022. A break above horizontal support at 7094 and the 200 sma at 7112 is needed for the buyers to gain traction.
On the downside, a break below 6830 yesterday’s low and 6810 the July low could spark a deeper selloff.
Oil rises as it looks to API data
Oil prices are on the rise paring some losses from yesterday as supply tightness in the US offers support. Production is still not back on line following the hit from Hurricanes. Royal Dutch Shell warned that full output won’t return to until 2022 owing to the damage caused by Hurricane Ida.
The ongoing energy crisis is also supporting oil prices as natural gas prices surge.
However gains are likely to be limited amid ongoing concerns over the potential impact of a default by Chinese property giant Evergrande on the wider economy. The Fed will also be in focus as the tapering debate looks set to heat up, supporting the USD at multi week highs.
API industry stockpile data is due later.
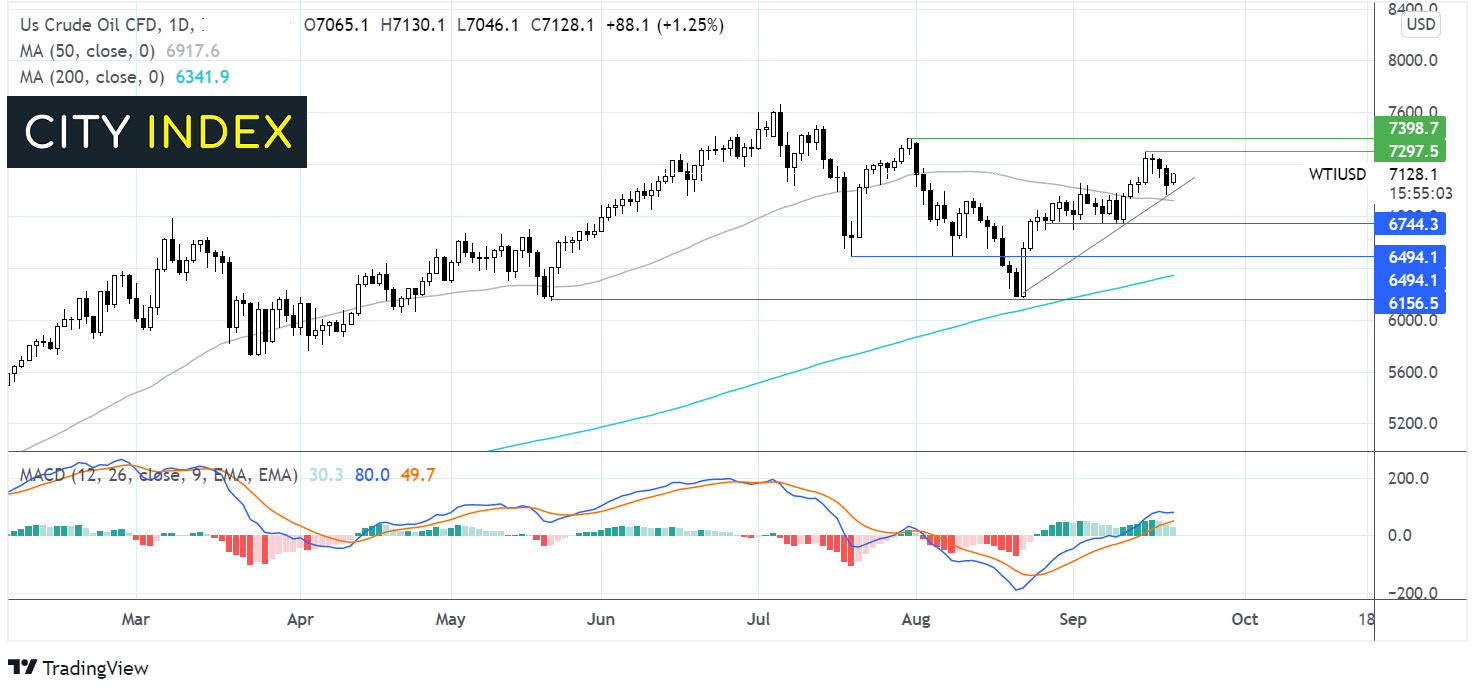
Where next for WTI oil?
WTI oil prices trade is extending its rebound off the month old support line towards $72.00. The bullish MACD combined with a sustained move over the 50 sma is keeping buyer’s hopeful of further gains. The bulls will be looking for a move over 73.00 to gain traction towards 74.00 the August high.
On the flip side, a break below the trendline support at 70.15 could open the door to the 50 sma at 69.35 negating the near term uptrend. It would take a move below 67.50 the September low for the sells to gather momentum.
How to trade with City Index
Follow these easy steps to start trading with City Index today:
- Open a City Index account, or log-in if you’re already a customer.
- Search for the market you want to trade in our award-winning platform.
- Choose your position and size, and your stop and limit levels
- Place the trade.
Latest market news
Latest Crude Oil articles
April 17, 2024 05:00 PM
April 17, 2024 03:02 AM
April 10, 2024 06:07 AM